Chi-Squared Test: Are These Two Things Related?
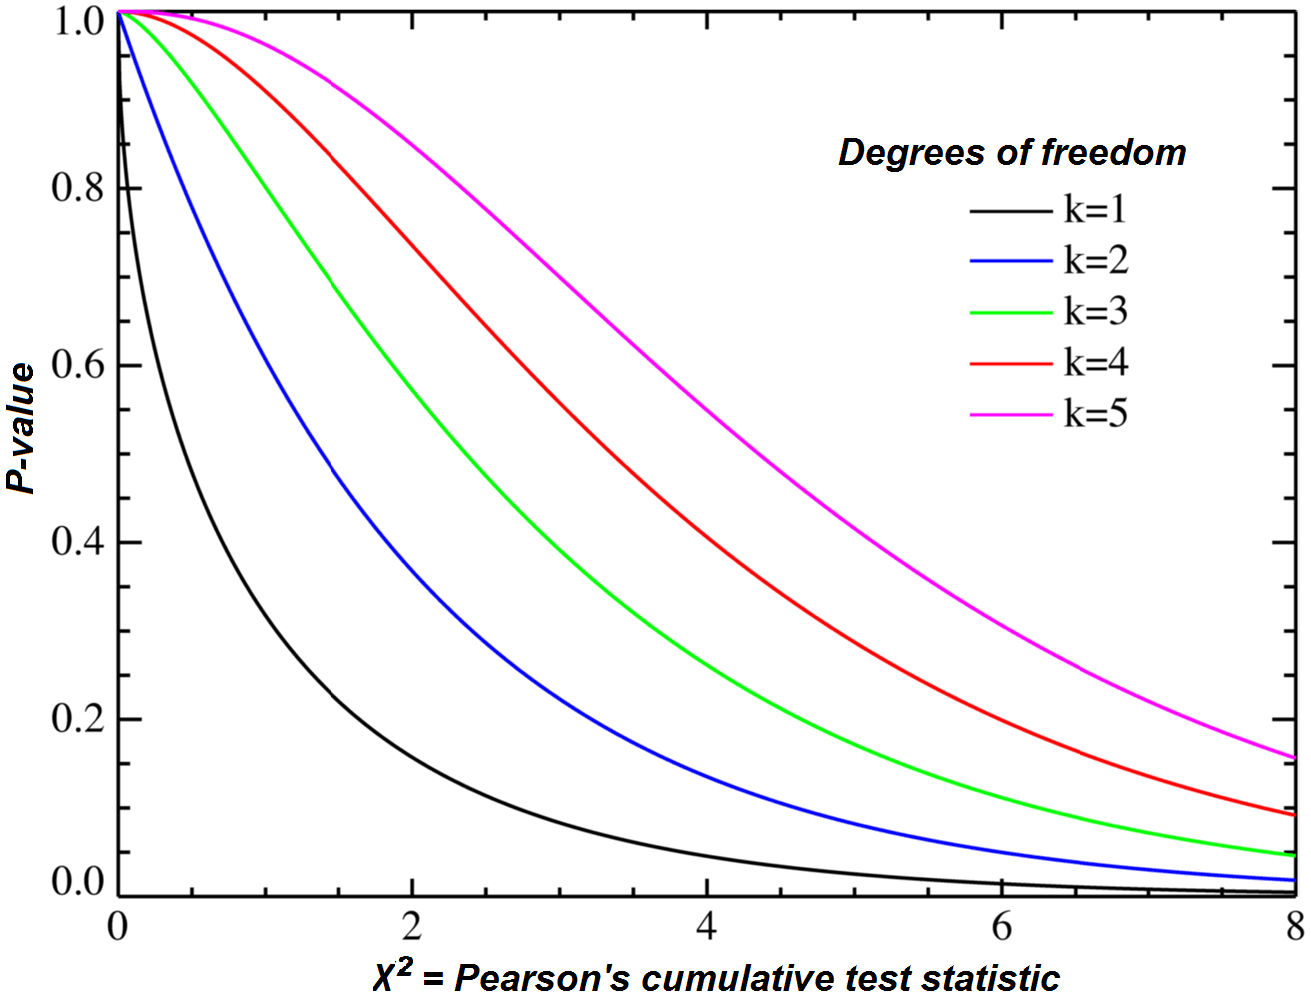
A Chi-Squared test detects 'surprising' differences between what you observe and what you'd expect. It's used to check if two categorical variables, like a landing page variant and a user's sign-up action, are independent or related.
Why it exists
We often need to know if two categorical things are related. For example, does changing the color of a 'Buy' button actually make more people click it? We need a formal way to distinguish a real effect from random noise in the data. The Chi-Squared test provides a statistical method to answer this for categorical data.
The mental model
Think of the Chi-Squared test as a formal way of measuring surprise. You start by assuming two variables are independent (the 'null hypothesis'). For example, you assume button color and click-through rate are unrelated. Then, you calculate what the click counts should look like in that 'unrelated' world. The test measures the squared difference between your actual, observed counts and these expected counts. A large difference means you're 'surprised', suggesting your initial assumption was wrong and the variables are likely related.
How it works
The process uses a contingency table, which cross-tabulates your two categorical variables (e.g., rows for 'Button A', 'Button B'; columns for 'Clicked', 'Did Not Click'). First, you calculate the 'expected' frequency for each cell, assuming independence. Then, for each cell, you compute (Observed - Expected)^2 / Expected. The sum of all these values is the Chi-Squared statistic. You compare this statistic to a critical value from a Chi-Squared distribution (or just look at the p-value) to determine if the result is statistically significant.
When to use it
Use it to compare two categorical variables when you have a large enough sample size. It's ideal for analyzing results from A/B tests where both the intervention and the outcome are categorical. Examples include testing different headlines on click-through rates, or seeing if user segment (e.g., 'new' vs. 'returning') affects feature adoption.
When not to use it
Do not use it for continuous variables (e.g., comparing average session duration; use a t-test for that). It's also unreliable for very small sample sizes, specifically when any cell in your expected contingency table has a count less than 5. This is a common footgun. Also, it only shows association, not causation.
One canonical example
An e-commerce site tests two checkout button texts: 'Complete Purchase' and 'Buy Now'. They observe the number of users who click each button versus those who abandon the cart. They create a 2x2 contingency table. The Chi-Squared test is used to determine if the difference in click rates between 'Complete Purchase' and 'Buy Now' is statistically significant, or if it could have just happened by chance.
Interview question
Which scenario is most appropriate for applying a Chi-Squared test?
- a.Analyzing the relationship between two categorical variables when many expected cell counts are less than five.
- b.Determining if there's a statistically significant association between two categorical variables.Correct
- c.Comparing the mean scores of a continuous variable across three different experimental groups.
- d.Establishing a direct causal link between a marketing campaign and increased sales.
Why? this is the answer
The Chi-Squared test is specifically designed to assess the association or independence between two categorical variables, as stated in the card. It explicitly notes that the test 'only shows association, not causation,' making option D incorrect.
Just read this? Test yourself on what you have been reading.
Read the original → en.wikipedia.org
- #statistics
- #ab testing
- #data science
- #hypothesis testing
Put your scrolling time to good use
Learn one idea, try a quiz and save useful cards for revision. Tezvyn makes it easy to learn and stay current in your tech field, a few minutes at a time.
The iPhone app is on the way
We are building it. Until it lands, nothing here is held back from you: every interview card, your saved cards, streaks and the job board all work in Safari, plus hundreds of free practice quizzes of thirty questions each. Sign in and it all carries over to the app the day it arrives.
Want it as an icon? Tap Share at the bottom of Safari, then Add to Home Screen. It opens full screen and the cards you have read stay available offline.
We are hiring for this. Open roles that interview on statistics — each one lists the topics its interview covers.
See open roles