Dimension Tables: The 'Who, What, Where, When' of Your Data
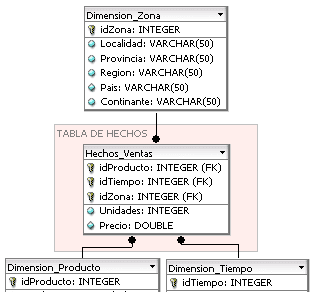
Dimension tables provide the descriptive context—the 'who, what, where, when'—for raw numbers in a fact table. They are the backbone of data warehouses, letting you slice sales data by product or region. The footgun is polluting them with transactional data.
WHY IT EXISTS: Raw data, like a list of sales transactions, is just numbers. To make sense of it, you need context. Was that sale for a laptop or a mouse? To a customer in New York or London? On a weekday or a weekend? Answering these questions requires joining raw facts with descriptive attributes. Dimension tables were created to store this descriptive context efficiently for analysis.
THE MENTAL MODEL: Think of a fact table as a spreadsheet of numbers (e.g., sales amount, quantity sold) and a dimension table as the labels for the rows and columns. The fact table tells you what happened in numerical terms, while the dimension tables tell you the who, what, where, and when behind those numbers. For example, a fact_sales table has a product_key, but the dim_product table tells you that product_key 123 is a "Red T-Shirt, Size L".
HOW IT WORKS: A dimension table has a single primary key (the dimension key) that is referenced by a foreign key in a central fact table. Each row represents a unique person, product, place, or time. The columns are descriptive attributes, like product_name, category, color, or brand. These tables are usually wide and denormalized, meaning they contain redundant information to avoid complex joins during analysis. For instance, a dim_store table might include city, state, and country in every row.
WHEN TO USE IT: Use dimension tables when building a data warehouse or data mart for business intelligence and analytical reporting (OLAP). They are essential for creating star or snowflake schemas. They are perfect for situations where you need to "slice and dice" data, such as viewing sales by region, analyzing website traffic by marketing campaign, or tracking employee performance by department.
WHEN NOT TO USE IT: Avoid this structure for Online Transaction Processing (OLTP) systems, like an e-commerce checkout system. These systems prioritize fast writes and data integrity through normalization (e.g., 3rd Normal Form). A wide, denormalized dimension table would be inefficient and difficult to maintain in a high-throughput transactional environment.
ONE CANONICAL EXAMPLE: A retail company has a fact_sales table with columns like date_key, product_key, store_key, and sales_amount. To understand these sales, they use dimension tables. The dim_product table, linked by product_key, contains columns like product_name and category. The dim_store table, linked by store_key, has store_name and city. An analyst can then join these tables to ask: "What were the total sales for the 'Electronics' category in the 'New York' city last quarter?"
Read the original → en.wikipedia.org
Get five bites like this every day.
Tezvyn delivers a daily feed of 60-second tech bites with quizzes to lock in what you learn.