OLAP Cube: Pre-Aggregating Data for Fast Analysis
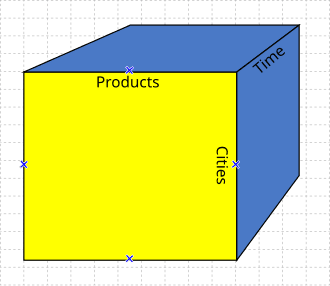
An OLAP cube is like a Rubik's Cube for your data, pre-calculating answers to complex business questions. It powers BI tools, letting you 'slice and dice' sales data by region and time for fast reports. The footgun: data is typically stale, not real-time.
WHY IT EXISTS Traditional databases (OLTP) are optimized for fast writes, like recording a single sale. They are slow at answering analytical questions that require scanning millions of rows, like 'What was the total revenue for all blue shoes sold in Germany last quarter?'. OLAP cubes were created to answer these complex queries in seconds, not minutes.
THE MENTAL MODEL An OLAP cube is a multi-dimensional array of data. Imagine a spreadsheet, but instead of just rows and columns (2D), you can add more 'dimensions' like time, product category, and geography. The cells of this 'cube' don't hold raw data; they hold pre-calculated summaries (aggregates) like sums or averages. This structure lets you 'slice' (view a single dimension, like sales for 2023) and 'dice' (zoom in on a sub-section, like sales of electronics in the Northeast for Q4) with very low latency.
HOW IT WORKS Data from one or more transactional systems is periodically extracted, transformed, and loaded (an ETL process) into the cube structure. During this process, the system calculates and stores aggregates for various dimensional combinations. For example, it calculates total sales not just per day, but also per week, per month, per quarter, and for every product in every store. When an analyst runs a query, the cube returns the pre-computed number instead of scanning the raw transaction table.
WHEN TO USE IT Use OLAP cubes for business intelligence (BI), financial reporting, and sales forecasting. They are ideal when analysts need to explore large datasets interactively from many different perspectives and require fast query responses. The key tradeoff is accepting slightly stale data in exchange for speed.
WHEN NOT TO USE IT Do not use OLAP cubes for real-time transactional systems (OLTP), like an e-commerce checkout process. The data is not live. They are also poorly suited for unstructured data or when the analytical questions are not known in advance, as the cube's dimensions are predefined.
ONE CANONICAL EXAMPLE A retail company uses an OLAP cube to analyze sales. The dimensions are Time (Year, Month, Day), Product (Category, SKU), and Location (Country, State, Store). The measure is Sales Amount. An analyst can use a BI tool to ask, 'Compare sales of 'Laptops' vs. 'Tablets' in 'California' vs. 'New York' for H1 2023.' The cube returns these aggregated values almost instantly because they were pre-calculated during the last data load.
Read the original → en.wikipedia.org
Get five bites like this every day.
Tezvyn delivers a daily feed of 60-second tech bites with quizzes to lock in what you learn.