t-SNE: Map High-Dimensional Similarity to 2D
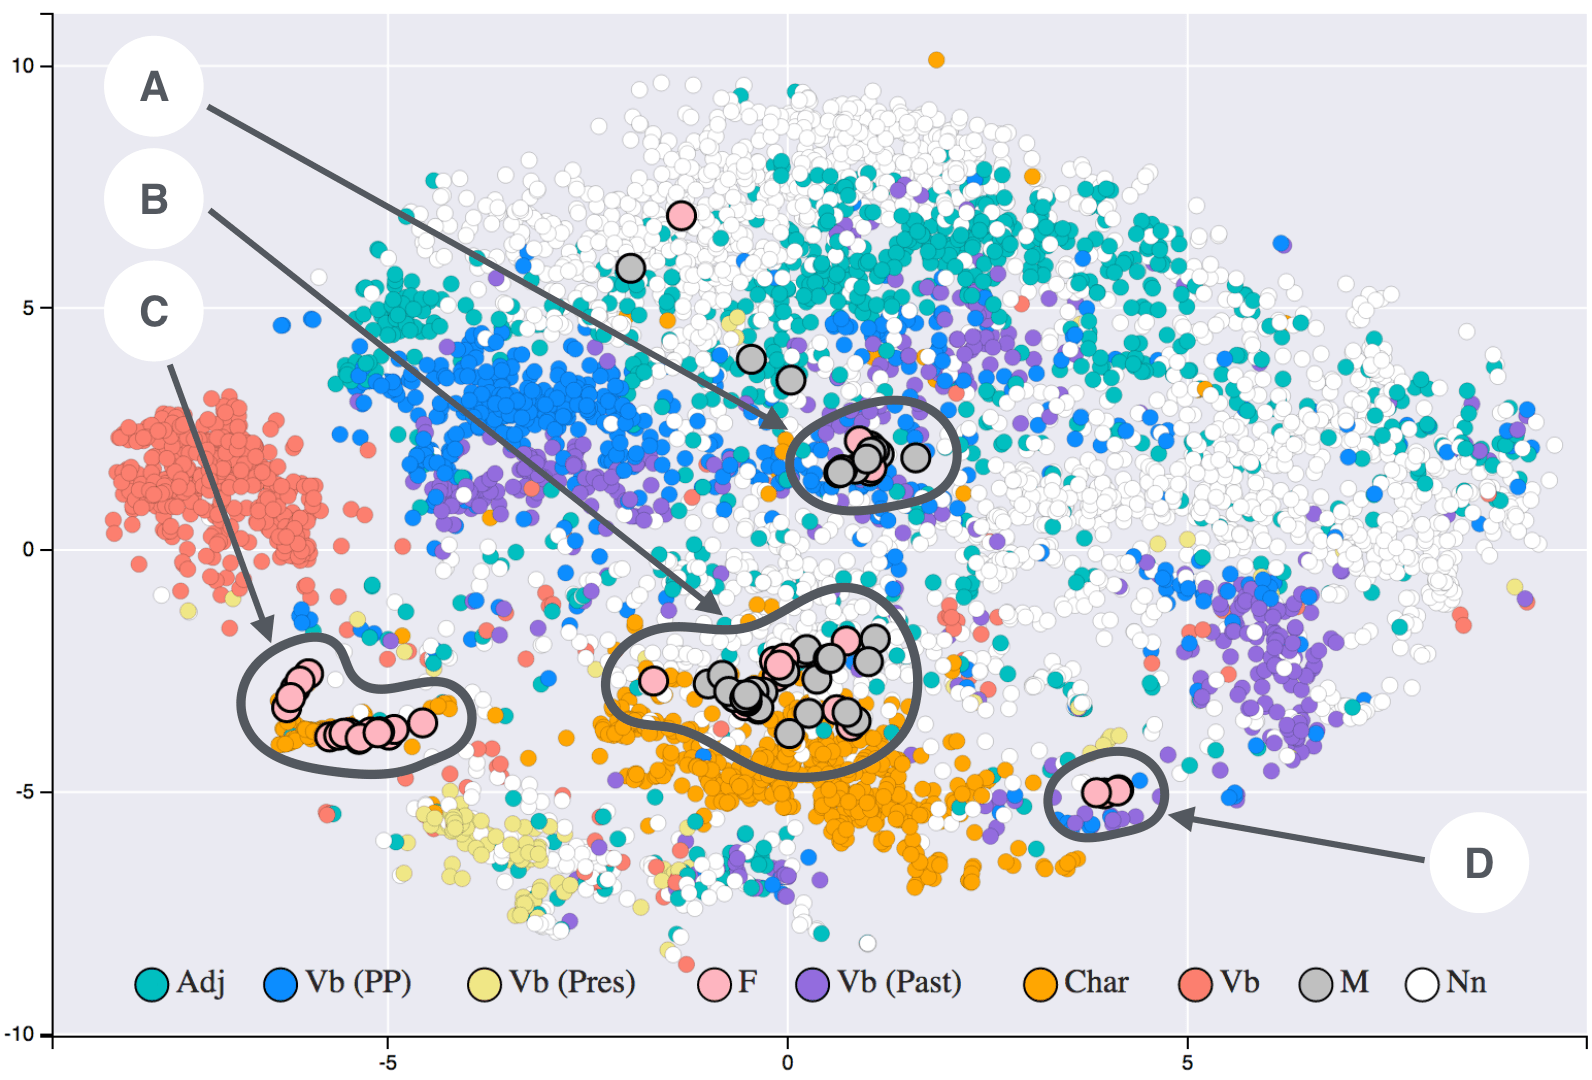
t-SNE turns high-dimensional similarity into 2D or 3D distance: similar points cluster and dissimilar points separate. Use it to visualize complex datasets on a flat map. Do not read exact distances from the plot; it preserves local probability, not geometry.
WHY IT EXISTS: High-dimensional data is impossible to visualize directly because screens and human perception are limited to two or three dimensions. Engineers need a way to see structure in datasets with hundreds or thousands of features without losing the relationships that matter. t-SNE was invented to solve this exact problem by creating a spatial map where visual proximity means statistical similarity.
THE MENTAL MODEL: Think of t-SNE as a translation service between the geometry of high-dimensional space and the flatland of a monitor. It does not try to preserve every measurement exactly. Instead, it asks which objects are neighbors in the original space and then arranges points on a 2D or 3D canvas so those neighbors stay close while strangers are pushed apart. The tradeoff is fidelity to exact distances for the ability to see clusters with your eyes.
HOW IT WORKS: The method is built on Stochastic Neighbor Embedding, originally created by Geoffrey Hinton and Sam Roweis. Laurens van der Maaten and Hinton later proposed the t-distributed variant that gives the technique its name. It is a nonlinear dimensionality reduction technique, meaning it does not assume relationships follow straight lines or flat planes. Each high-dimensional object receives a coordinate in a two- or three-dimensional map. The algorithm places similar objects at nearby points and dissimilar objects at distant points, and it does so with high probability rather than rigid guarantees.
WHEN TO USE IT: Use t-SNE when you need to visualize complex high-dimensional data on a flat screen. It shines during exploratory data analysis when you want to confirm whether natural groupings exist in a dataset that is too large and too multidimensional to inspect raw tables. It is specifically designed for visualization in two or three dimensions, so it is the right tool when the end product is a plot for human interpretation.
WHEN NOT TO USE IT: Do not use t-SNE when you need precise distances or faithful global structure between every pair of points. Because it models similarity as a probability, the absolute positions and spacing between clusters can be misleading. It is not a general-purpose dimensionality reduction method for feeding features into downstream models, and it should not be treated as a measurement tool. If your workflow requires exact geometry or preservation of far-away relationships, t-SNE will mislead you.
ONE CANONICAL EXAMPLE: A classic use case is taking a dataset where each datapoint carries hundreds of features and producing a two-dimensional scatter plot. In that plot, two points sitting next to each other likely represent similar original objects, while points on opposite sides likely represent dissimilar ones. The map makes it possible for a human to spot patterns that would be invisible in a spreadsheet.
Read the original → en.wikipedia.org
Get five bites like this every day.
Tezvyn delivers a daily feed of 60-second tech bites with quizzes to lock in what you learn.