
Escalation Policy: When to Stop Shipping and Start Fixing
An escalation policy is a pre-agreed plan for when to divert engineers from feature work to fix reliability. When a service's error budget burns too fast, the policy's thresholds trigger specific actions. The footgun is thinking a quick rollback is enough.

Time-Series Compression: Storing More with Less
Time-series compression stores data more efficiently by saving the *difference* between consecutive points, not the full values. It's key for managing terabyte-scale monitoring and IoT data, often saving over 90% on storage.

Service Maps: A Live Blueprint of Your Architecture
A service map is a live blueprint of your distributed system, generated from telemetry data. It visualizes service dependencies and health, letting you instantly see an incident's blast radius instead of hunting through Slack for tribal knowledge.

Bulkhead Pattern: Isolate Failures, Protect Your System
The Bulkhead pattern partitions a system like a ship's hull, containing failures to prevent a total outage. By isolating resource pools for each service or consumer, a fault in one component won't cascade and take down the entire application.
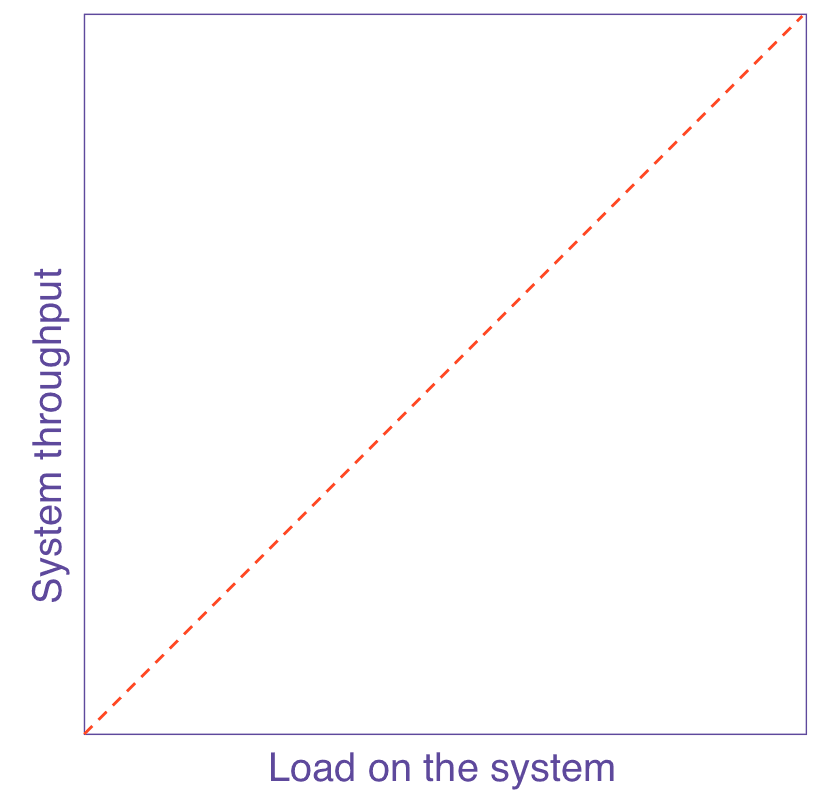
Universal Scalability Law: The Physics of Scaling
The Universal Scalability Law (USL) models throughput by quantifying the two costs of parallelism: contention and coherency. Use it to forecast performance and diagnose bottlenecks.

Performance Budgets: Set Limits to Stay Fast
A performance budget is a hard limit on metrics like bundle size or load time, acting as a guardrail against regressions. It's used in CI/CD to fail builds that exceed size limits or in monitoring to alert when load times degrade.

Shadow Deployment: Test in Production, Safely
Shadow deployment copies live user traffic to a new "shadow" service for testing without user impact. It's used to validate new code versions with real-world load or to analyze traffic for security threats.

Automated Canary Analysis: Let the Metrics Decide
Automated canary analysis uses metrics to decide if a new release is safe. It compares a new 'canary' version against the stable 'baseline' in production, scoring its health before a full rollout.

Swiss Cheese Model: Layered Defenses Against Failure
Think of system defenses as slices of Swiss cheese. An accident happens only when the holes—weaknesses in each layer—align. It's used in post-mortems to see how small failures combine into a major outage.

Beyond 'Root Cause': Proximate vs. Contributing Factors
A proximate cause is an incident's final trigger, while contributing factors are the conditions that made it possible. This helps post-mortems move beyond blame to find systemic risks.

Mean Time to Acknowledge (MTTA): Your First Response Clock
MTTA measures the time from an alert firing to a human acknowledging it. It's about reaction speed, not fix time. On-call teams use this to ensure issues are seen quickly, minimizing downtime.

On-Call Management Platforms: Who Wakes Up?
An on-call platform is a smart switchboard for production alerts, ensuring the right engineer gets paged when things break. It connects monitoring tools to on-call schedules and escalation rules.

Query Federation: Combining Prometheus Servers
Query federation lets one Prometheus server scrape metrics from another, creating a meta-monitor. Use it to build a global view from local servers or to combine application and infrastructure metrics for richer alerts.

Loki: The Log System That Indexes Labels, Not Text
Loki is a log system that indexes only metadata labels, not the full log content. This makes it cheaper and simpler to run than full-text indexing systems, storing compressed logs in object storage.

Downsampling: Trading Granularity for Speed in Time Series Data
Downsampling trades resolution for speed by summarizing old, high-granularity metrics into coarser ones. This makes long-range queries faster and cheaper, common in systems like Thanos for long-term Prometheus data.

Grafana: Your Single Pane of Glass for Observability
Grafana is the universal dashboard for your system's health, visualizing metrics, logs, and traces from different sources in one place. Use it to monitor application performance and infrastructure health.

Prometheus: Monitoring with a Dimensional Data Model
Prometheus models system health as labeled time series, not just flat metrics. It pulls data from targets, making it ideal for dynamic cloud environments like Kubernetes. The footgun is using high-cardinality labels, which can overwhelm its storage.
Prometheus Exemplars: Link Your Metrics to Traces
Exemplars are like footnotes for your metrics, linking a data point like a latency spike directly to a specific trace ID. This lets you jump from a 'what' on a dashboard to the 'why' in your tracing system.
Error Budget Burndown: Your Service's Reliability Fuel Gauge
An error budget burndown chart is a fuel gauge for your service's reliability. It shows how much 'allowable downtime' you've used, helping you decide when to ship features versus fix bugs. The footgun is ignoring a steep burn rate until it's too late.

Health Checks: Is Your Service Alive or Just Running?
A health check answers 'Can you do your job?', not just 'Are you running?'. Load balancers and orchestrators use this API endpoint to stop routing traffic to sick instances.