
Points of Parity: First Be 'Good Enough,' Then Be Different
Points of Parity are the 'good enough' features a product needs to even compete. Before you can win with your unique Points of Difference, you must first meet these basic expectations. The footgun is ignoring parity and being disqualified by default.
Positioning Statement: Your Product's Internal Compass
A positioning statement is an internal compass, not a public slogan. It defines your product's unique place in the market for a specific customer, guiding all marketing and product decisions.

Visiontype: Prototyping Your 3-5 Year Product Future
A visiontype is an interactive prototype of your product's 3-5 year future, making abstract goals tangible. It aligns teams on a long-term direction, breaking the cycle of purely incremental updates. The biggest mistake is creating it in a silo.

The Hedgehog Concept: Know Your One Big Thing
The Hedgehog Concept trades scattered efforts for focused strategy. It's the intersection of what you're passionate about, what you can be the best at, and what drives your economic engine. Use it for long-term strategic clarity.

BHAG: The Big Hairy Audacious Goal
A BHAG is a huge, daunting goal that unifies an organization, like NASA's moonshot. It's a 10-25 year objective that is clear, compelling, and has a defined finish line. The footgun is mistaking a vague mission statement for a tangible BHAG.

Sales Battle Cards: Frame Your Competition, Don't Just Attack Them
A sales battle card is a one-page cheat sheet that frames your competitor's product for a different audience, not just lists its flaws. Sales teams use it to steer conversations toward your strengths.

Network Effects: Value Grows with Users
A product with network effects is like a telephone: its value grows as more people join. This powers social media, marketplaces, and communication tools. The main pitfall is the 'cold start problem'—attracting the first users to an empty, valueless network.
The Competitive Matrix: Visualizing Your Strategic Edge
A competitive matrix is a map of your market, plotting your product against rivals on key axes like price and features. Use it to spot market gaps, justify new features, or refine pricing.

Generative vs. Evaluative Research: Define Problems vs. Judge Solutions
Generative research defines problems by asking, "What should we build?" Evaluative research judges solutions by asking, "Did we build it right?" The footgun is using evaluative methods for discovery, which just optimizes a solution for a problem nobody has.
How Might We: Frame Problems, Not Solutions
“How Might We” questions turn research insights into broad prompts for brainstorming. Use them after user research to frame design challenges before ideating. The biggest footgun is embedding a solution in the question, which kills creativity.
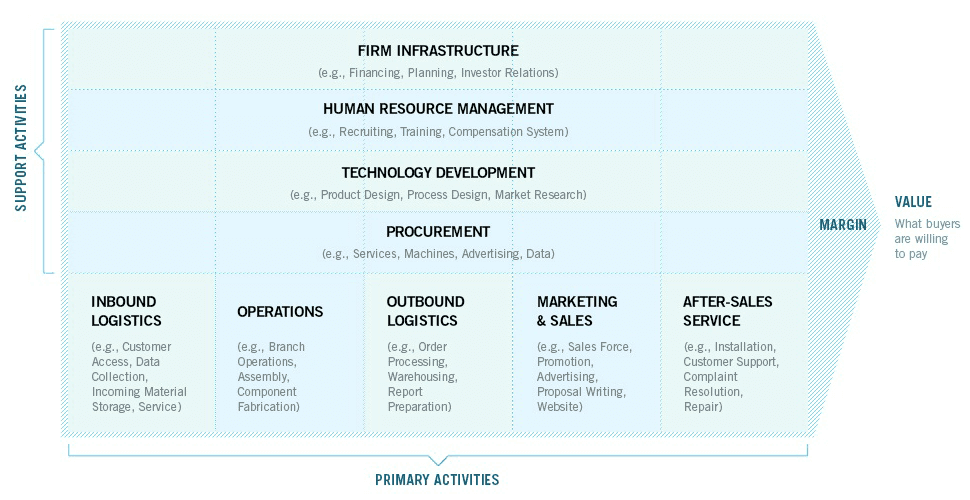
Value Chain Analysis: Find Your Edge by Mapping Your Activities
Value Chain Analysis maps a company's activities to find its competitive edge. Instead of a list of costs, it shows how each step adds value, revealing where you can lower costs or justify higher prices.

User Personas: Build for a 'Who', Not a 'What'
Personas are fictional character sheets for your ideal users, grounding product decisions in human needs, not just features. They guide choices from UI to marketing by asking "What would our user do?".

Strategy vs. Tactics: The Map vs. The Directions
Strategy is your destination and why you're going; tactics are the turn-by-turn directions. A product strategy defines the long-term goal, like 'capture the enterprise market,' while tactics are the specific feature launches to get there.
Quantitative Growth Model: The Spreadsheet That Runs Your Business
A quantitative growth model is a spreadsheet that maps your business, showing how inputs like ad spend turn into revenue. It's used to forecast growth, simulate strategy changes, and set goals. The footgun: your model is only as good as its assumptions.
What a Head of Growth Actually Does
A Head of Growth is a systems architect for revenue, deciding where to place strategic bets, not just a campaign manager. They align product, engineering, and marketing around shared metrics and build the experimentation engine.

Growth Engineer: The Entrepreneur Inside the Company
A growth engineer is an entrepreneurial developer using code to directly drive business metrics. They work across the product, optimizing onboarding or running experiments to boost activation.

Guardrail Metrics: Don't Win the Battle to Lose the War
Guardrail metrics are your experiment's safety net, ensuring a win in one area doesn't cause a loss elsewhere. During A/B tests, you monitor them to catch negative side effects on site speed or revenue.

The PIE Framework: Prioritizing What to Test Next
The PIE framework ranks A/B test ideas by scoring them on Potential, Importance, and Ease. It helps teams decide where to experiment first, focusing limited resources on high-impact changes.
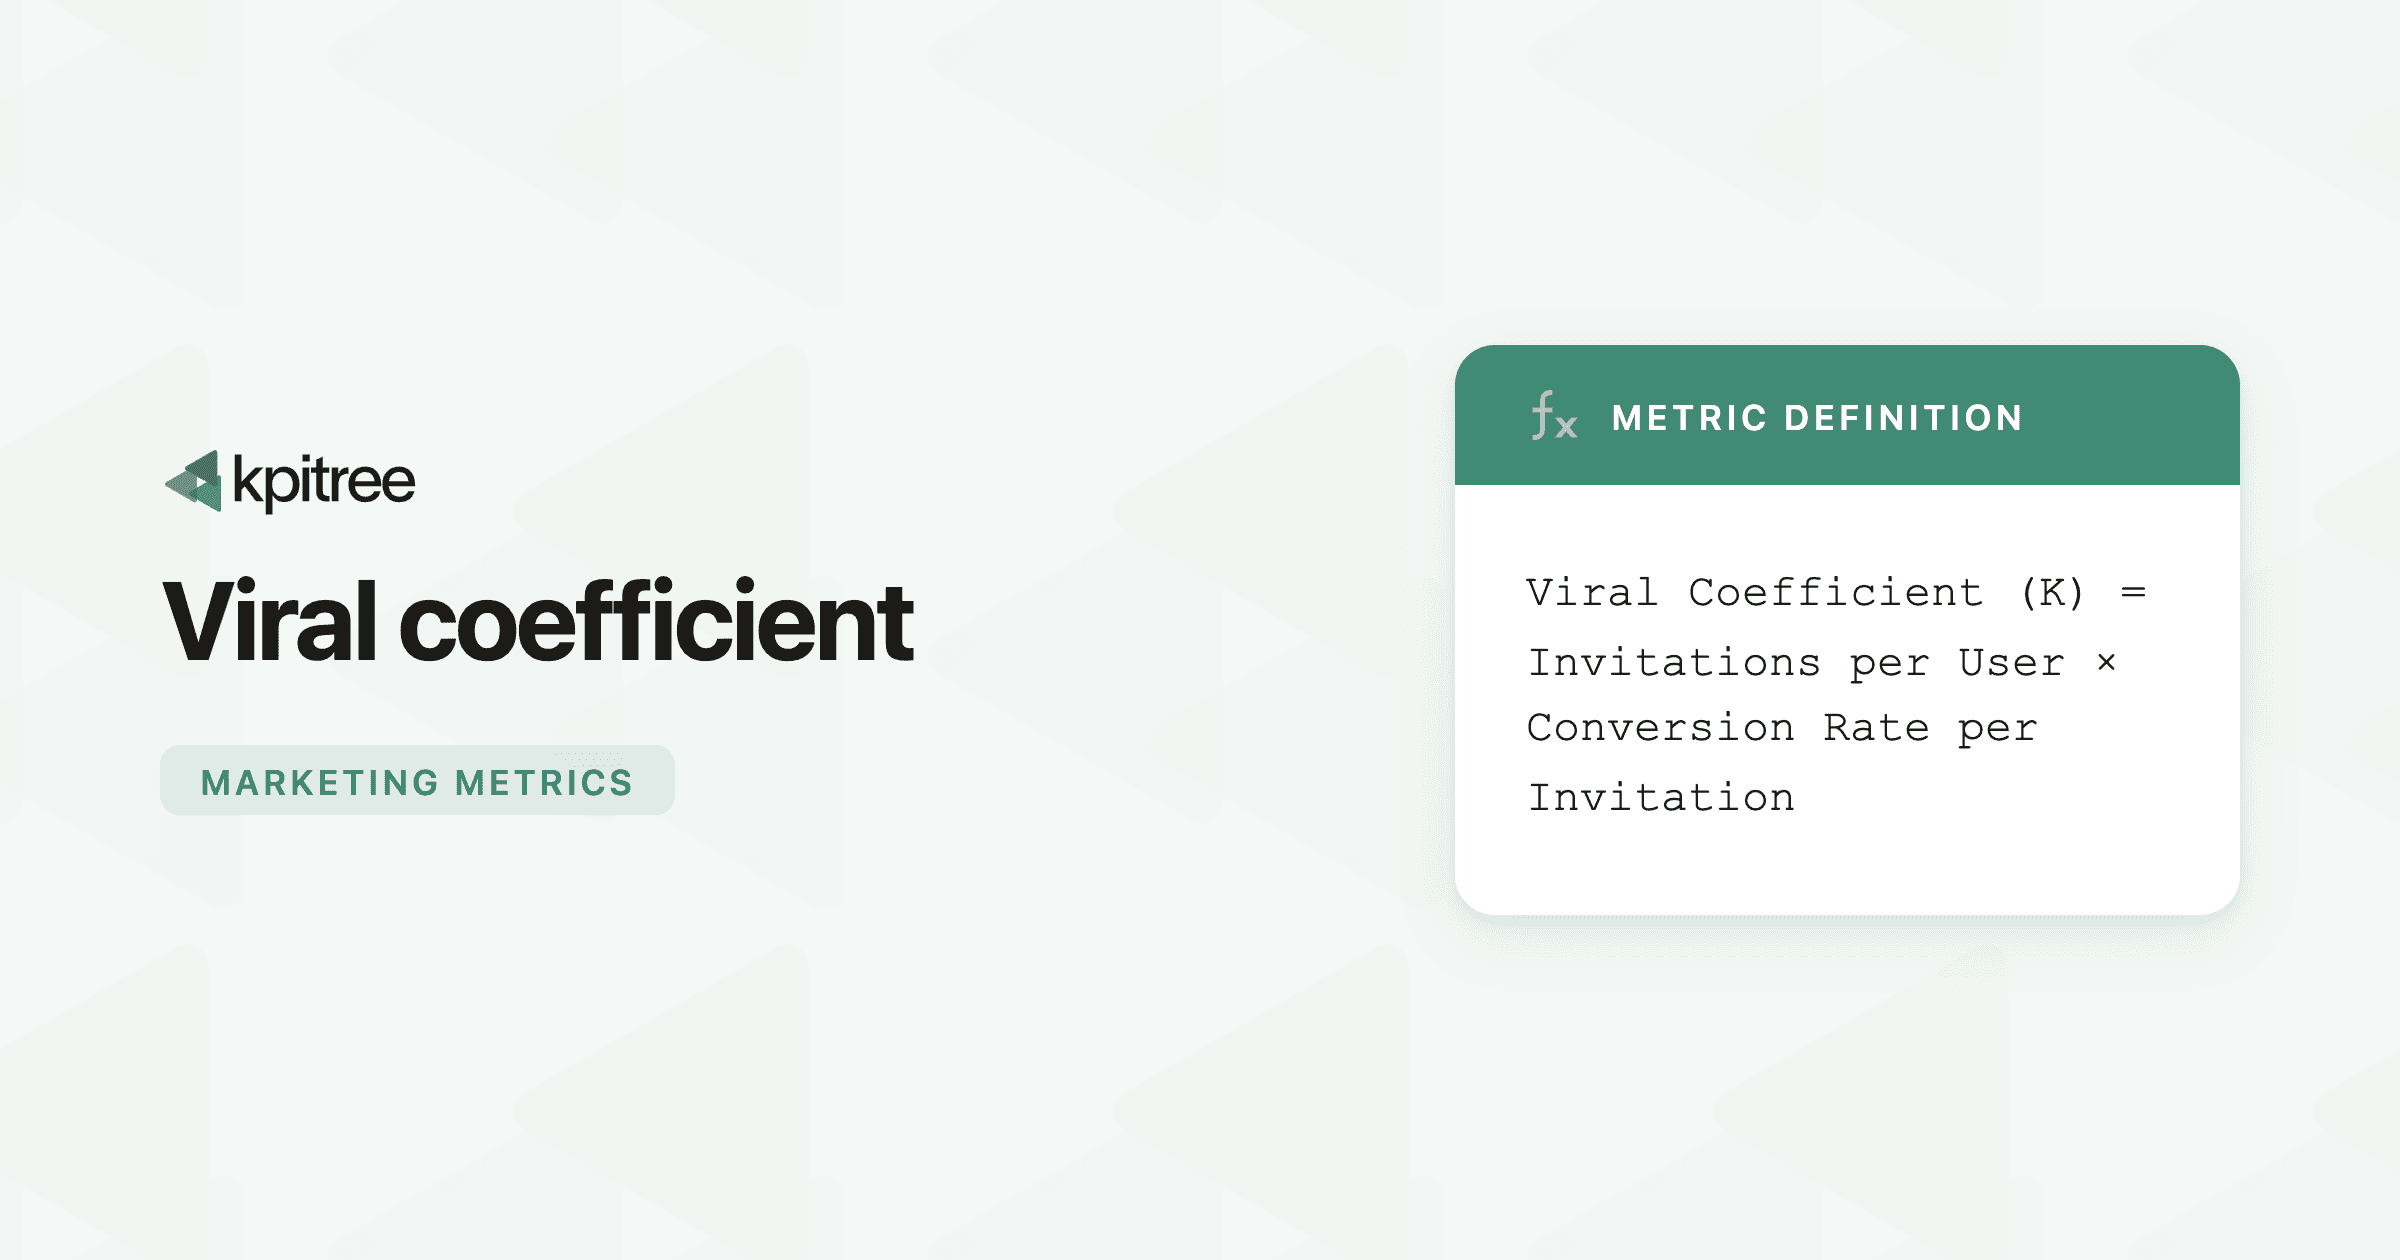
The K-Factor: Measuring Your Product's Viral Growth
The Viral Coefficient (K-factor) measures how many new users each existing user generates. It's key for products with referrals or sharing. The common mistake is chasing K > 1; even K=0.5 is valuable, as it effectively halves your acquisition cost.

AARRR: Pirate Metrics for the Customer Lifecycle
The AARRR framework maps your customer's journey through five key stages: Acquisition, Activation, Retention, Referral, and Revenue. It helps startups diagnose leaks in their growth funnel, from first visit to final sale.