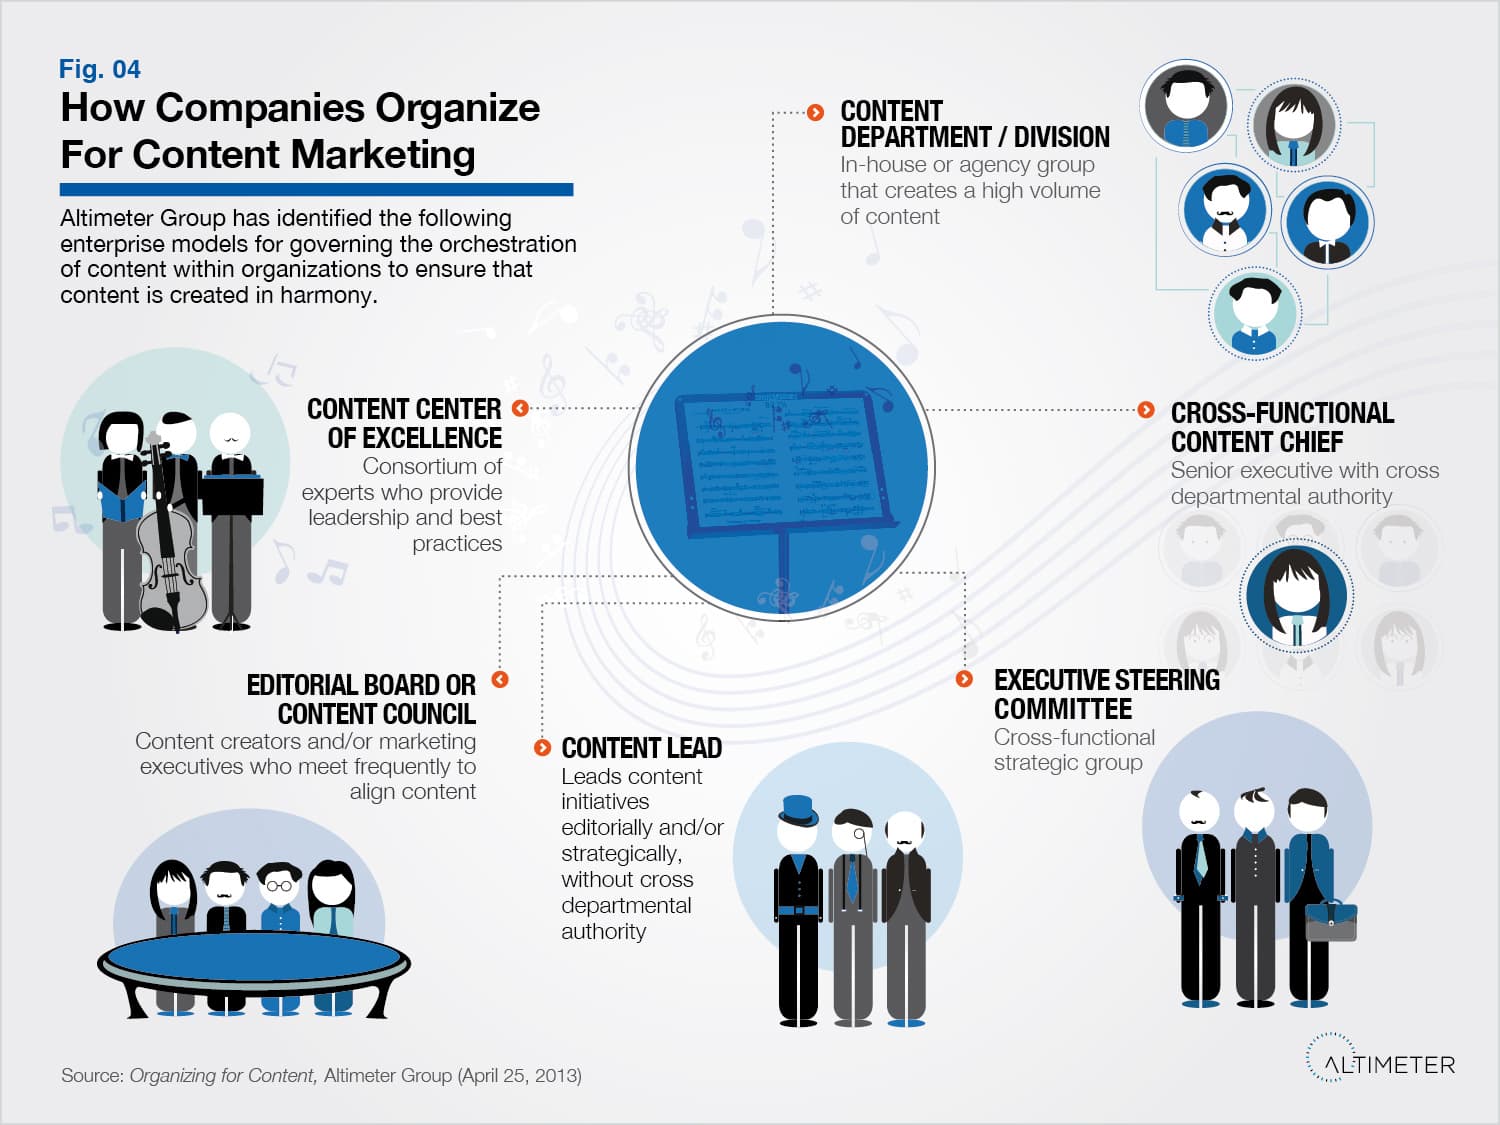
Content Marketing: Earn Trust, Not Just Clicks
Content marketing earns trust by giving away valuable information for free. It's used in company blogs or whitepapers to attract an audience by solving their problems, not just pushing a product.
Regression to the Mean: Why Outliers Settle Down
Extreme results are part skill, part luck. Regression to the mean is the principle that luck evens out, so a follow-up measurement will be closer to the average. This impacts A/B tests and performance analysis.

The RICE Scoring Model: Prioritize with Data, Not Feelings
RICE is a formula—(Reach × Impact × Confidence) / Effort—for scoring competing features. It replaces gut feelings with a data-driven framework for prioritizing product roadmaps. The biggest footgun is treating the score as gospel, not a conversation starter.

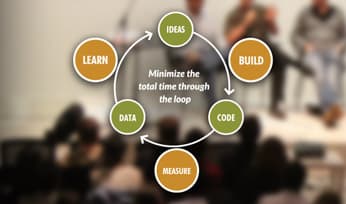
Hypothesis-Driven Development: Test Your Ideas Before You Build
Hypothesis-Driven Development treats product work as a series of experiments, not a to-do list. You state a testable belief ("If we build X, users will do Y") before writing code. This de-risks new features by validating ideas early.

Fogg Behavior Model: Why Users Act (or Don't)
The Fogg Behavior Model states a behavior only happens when Motivation, Ability, and a Prompt converge (B=MAP). Use it to diagnose why a feature fails or to design new ones. The footgun is blaming low motivation when the real issue is low ability.
Schema-on-Read vs. Write: Pay for Structure Now or Later?
Schema-on-Write pays to structure data upfront for fast, consistent reads. Schema-on-Read defers this cost to query time for flexible ingestion. This choice underpins relational databases (write) vs. data lakes (read). The footgun is creating a data swamp.

The Data Layer: A Central Hub for Website Events
A data layer is a central JavaScript object acting as a message bus between your site and analytics tags. It passes event data, like button clicks or purchase values, in a structured way. The key footgun: never overwrite it; always use `dataLayer.push()`.
User Activation: Engineering the 'Aha' Moment
User activation engineers the 'aha' moment when a new user first experiences your product's value. It's measured by a key action, like sending a message in Slack, that predicts retention.
User Journey Mapping: Seeing Your Product Through a User's Eyes
A user journey map tells the story of a user achieving a goal, visualizing their actions, thoughts, and feelings from start to finish. It's essential for understanding complex, multi-channel processes.
The Pivot: A Structured Change in Strategy, Not Vision
A pivot is a structured course correction, not a restart. You change strategy based on validated learning from your MVP when data shows your initial hypothesis was wrong. The footgun is pivoting on a whim instead of data, or failing to pivot despite it.
ICE Score: A Quick Framework for Prioritizing Ideas
The ICE score is a quick framework for ranking ideas by asking: what's the potential Impact, our Confidence in the outcome, and the Ease of implementation? Growth teams use it to prioritize experiments, balancing big bets with quick wins.

High-Tempo Testing: Move Faster Than Your Channels Decay
High-tempo testing treats growth as a continuous experiment, not a one-time campaign. Since marketing channels decay quickly, this lets you find new wins across the entire user journey.

Color Theory: Guiding the Eye in Data Visualization
Color in a chart is a cognitive shortcut, telling the viewer's brain what to notice and how to feel. Use it to highlight trends (green for growth) or group categories. The footgun is using too many colors, which creates noise and obscures insights.

Data Dashboards: The Single-Page Business Story
A data dashboard is the executive summary for your metrics, telling a story on a single page with key visualizations. It consolidates data from multiple reports, providing a high-level view to monitor business performance.

Analytics CoE: Centralizing Your Data Strategy
An Analytics Center of Excellence (CoE) is an internal data consulting group, centralizing experts to set standards and drive strategy. It helps large organizations standardize data quality and tooling. The footgun: becoming a bottleneck that slows teams down.
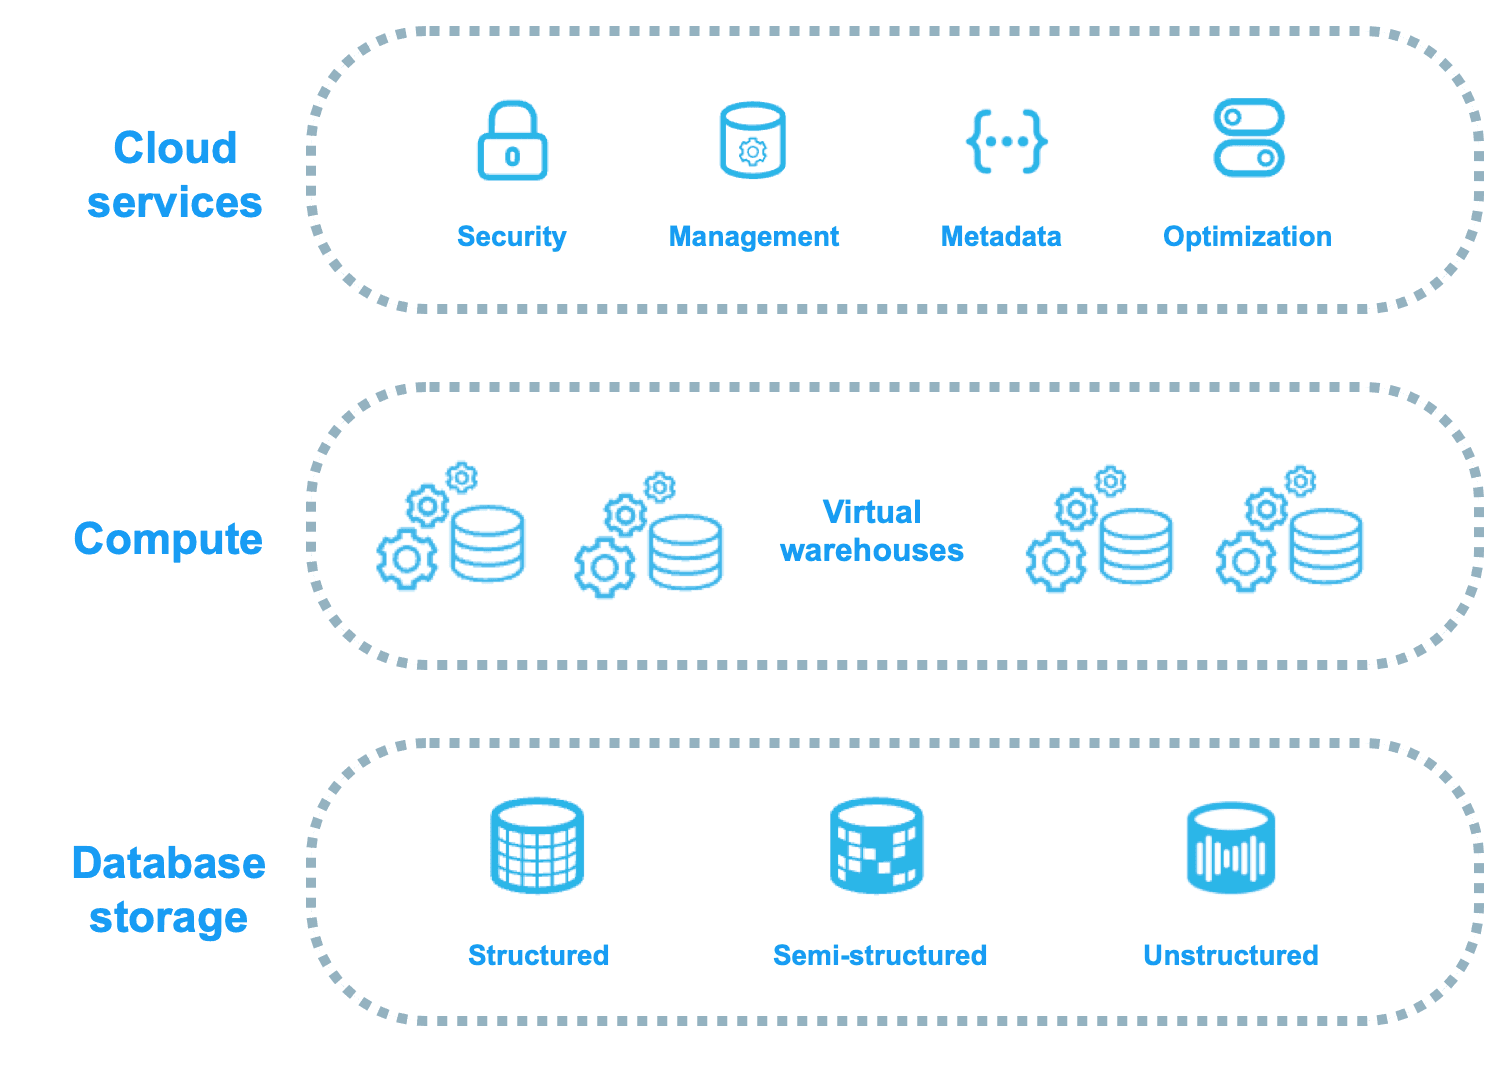
Snowflake: Decoupled Storage and Compute
Snowflake decouples storage from compute, acting like a shared-disk system for data management but a shared-nothing system for query performance. This lets you scale compute and storage independently, ideal for variable analytic workloads.

Multivariate Testing: Finding the Best Combination
Multivariate testing (MVT) finds the best *combination* of changes, not just the best single change. It tests multiple elements at once, like three headlines and two button colors, to see how they interact.

Period-over-Period Analysis: Measuring Change Over Time
Period-over-Period analysis answers 'Are we getting better?' by comparing metrics from consecutive time blocks, like this month's sales vs. last month's. The footgun is ignoring seasonality, which can create false signals of growth or decline.
The HEART Framework: Measuring User-Centric Success
The HEART framework measures user-centric success, not just clicks. It provides five categories (Happiness, Engagement, Adoption, Retention, Task Success) to track product health.

Vanity vs. Actionable Metrics: Measure What Matters
Actionable metrics are levers that change business outcomes; vanity metrics are scoreboard numbers that feel good but don't inform decisions. Use this distinction when setting KPIs to avoid the footgun of celebrating 'total downloads' over actual retained…