ACF vs. PACF: A Time Series Signal and Its Echo
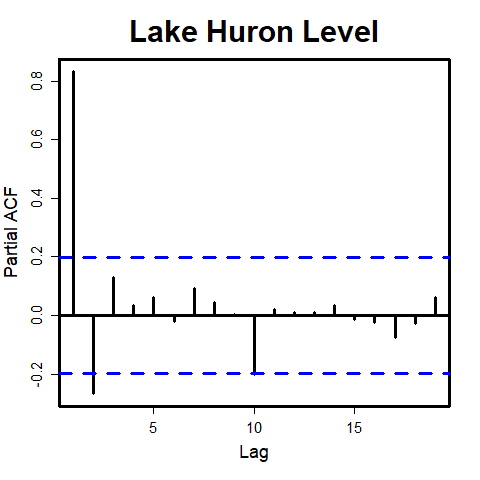
Autocorrelation (ACF) measures a time series's total correlation with its past, including indirect echoes. Partial Autocorrelation (PACF) isolates the direct correlation by removing intermediate effects. They help select forecasting model parameters.
THE MENTAL MODEL: Imagine shouting in a canyon. The Autocorrelation Function (ACF) is the entire sound you hear back—the initial echo, plus the echo of that echo, and so on. The Partial Autocorrelation Function (PACF) is like a special microphone that only records the first echo from a specific distance, filtering out all the reverberations caused by closer canyon walls. ACF measures total correlation (direct + indirect); PACF measures direct correlation only.
HOW IT WORKS: ACF at lag 'k' is the simple correlation between a time series and its values 'k' periods ago. It includes the influence of all intervening data points (lags 1, 2, ..., k-1). PACF at lag 'k' gives the partial correlation with the 'k'-lagged value after controlling for, or regressing out, the influence of all shorter lags. It calculates the 'new' information that lag 'k' provides that wasn't already explained by the lags before it.
WHEN TO USE IT: The primary use is identifying parameters for time series forecasting models like ARIMA. The shapes of the ACF and PACF plots are signatures of underlying processes. For an Autoregressive (AR) process of order 'p', the PACF plot will cut off sharply after lag 'p'. For a Moving Average (MA) process of order 'q', the ACF plot will cut off sharply after lag 'q'. This is a cornerstone of the Box-Jenkins model selection method.
WHEN NOT TO USE IT: Do not apply ACF/PACF to a non-stationary time series (one with a trend or changing variance). The results will be misleading, typically showing a very slow decay in the ACF that just reflects the trend. You must first make the series stationary, often by differencing it (e.g., using daily changes instead of absolute price levels). Also, these functions measure correlation, not causation.
ONE CANONICAL EXAMPLE: Consider daily e-commerce sales. The ACF might show significant correlation at lags 7, 14, and 21, suggesting a weekly pattern. But is the correlation at day 14 just an echo of the strong 7-day correlation? The PACF plot answers this. If the PACF shows a single large spike at lag 7 and then drops to insignificance, it implies the direct relationship is weekly. The 14 and 21-day correlations are just reverberations. This pattern suggests an AR(7) model might be appropriate.
Read the original → en.wikipedia.org
Get five bites like this every day.
Tezvyn delivers a daily feed of 60-second tech bites with quizzes to lock in what you learn.