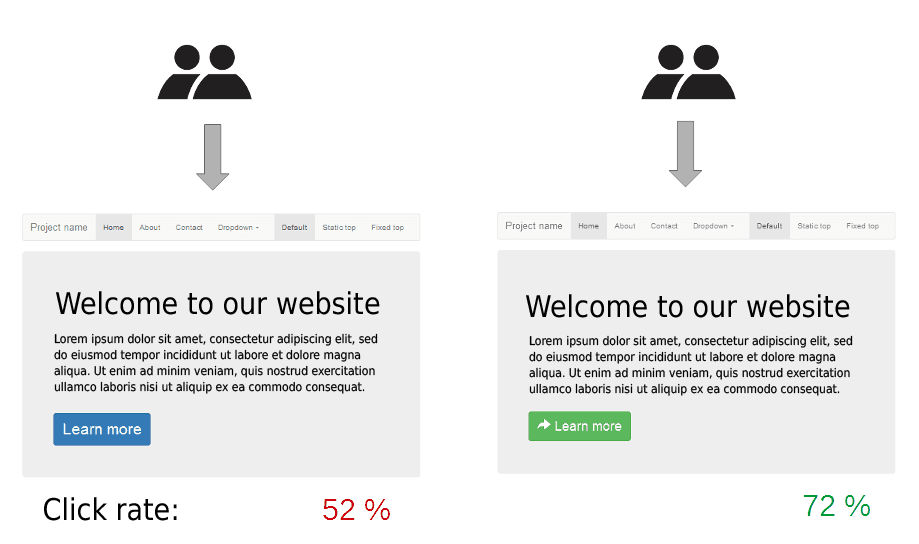
Describe the architecture of a generic A/B testing framework
WHAT IT TESTS: system design with statistical safety. ANSWER OUTLINE: hash-based user bucketing, config service, pre-registered metrics, and confidence intervals on dashboards. RED FLAG: request-level randomization or skipping power analysis.

Which classical baseline model handles weekly seasonality and upward trend?
Tests matching model structure to data characteristics. Name Holt-Winters triple exponential smoothing; map its level, trend, and seasonal equations to weekly period. Red flag: jumping to SARIMA without explaining why ETS is the natural baseline.
How do you measure forecast accuracy and compare MAE to RMSE?
This tests out-of-sample validation and how MAE and RMSE weight errors. A strong answer demands a train-test split, defines both, and notes RMSE punishes outliers more while MAE is more robust. A red flag is citing in-sample fit instead of held-out error.
Trade-offs between pre-aggregated and raw event data for dashboards
WHAT IT TESTS: Balancing latency, cost, and freshness in analytics. ANSWER OUTLINE: Pre-aggregations trade freshness for speed; raw queries preserve flexibility but spike cost and latency under load.

Propose a North Star Metric for a product you know
WHAT IT TESTS: Can you isolate the one metric capturing user value that predicts business health. A GOOD ANSWER COVERS: definition; your product's metric; how value drives retention and revenue.

Apply AARRR to B2B SaaS vs B2C mobile game analytics
This tests mapping AARRR to instrumentation across business models. A strong answer contrasts B2B account activation and expansion against B2C session-zero funnels and whale monetization. Red flag: same metrics ignoring account hierarchies and ad attribution.
What is the difference between a metric and a KPI?
Tests strategic vs operational measurement discernment. Answer: KPIs track critical goals; metrics track processes. Page views are a metric; conversion rate is the KPI. Red flag: calling all data KPIs or using page views as success proof.

How do you root-cause a 20% revenue drop with no pipeline failures?
WHAT IT TESTS: Incident leadership and validating data integrity before calling a downturn. ANSWER OUTLINE: Reconcile against raw events, slice by dimension for silent gaps, audit schema drift.

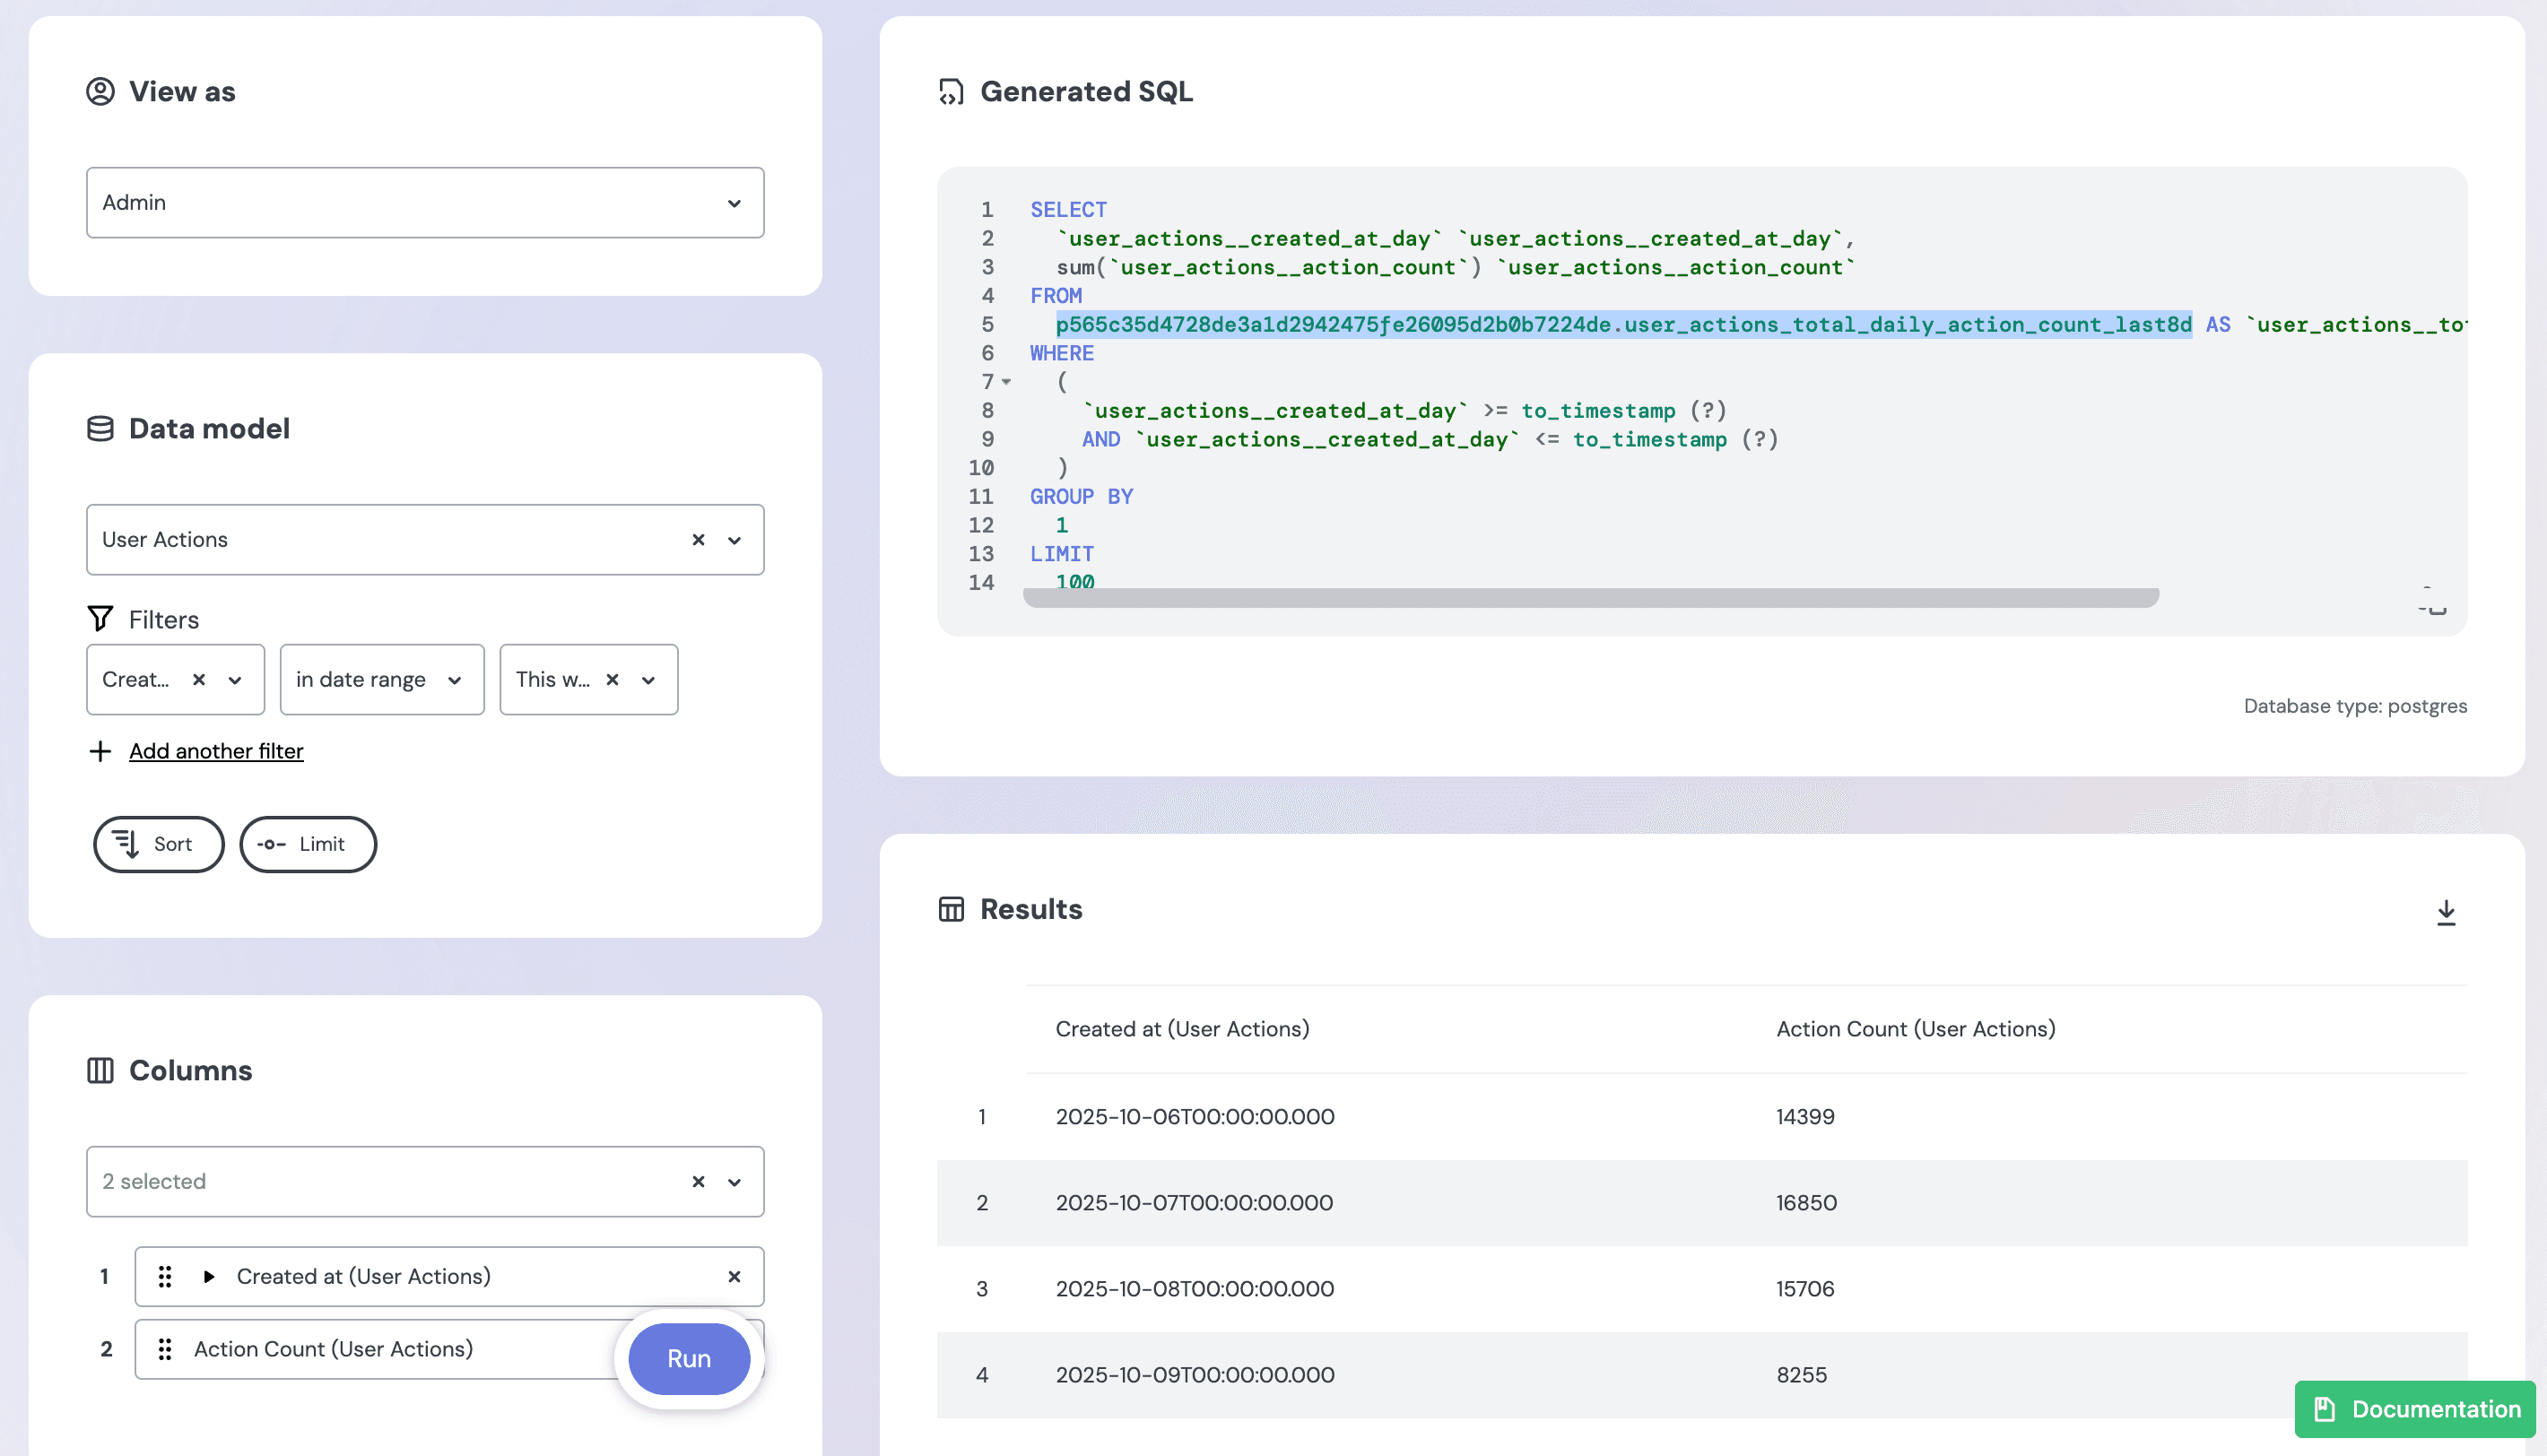
Propose a technical architecture for a centralized Metrics Layer or Metrics Store
This tests your ability to decouple metric semantics from storage and query tools. A strong answer outlines a semantic layer with versioned definitions, a query API, and enforced downstream consumption.
Design a real-time mobile analytics pipeline
Tests decoupling high-volume ingestion from low-latency querying. Strong designs use an event broker, a stream processor for windowed aggregates, and an OLAP database for sub-second dashboards.

Design a data model for feature adoption tracking
Tests dimensional modeling for high-volume events so PMs can query Feature A not B without complex SQL. A strong answer uses an event fact table plus a materialized user-feature summary. Red flag: a wide user table with boolean columns per feature.

Explain cohort retention and write a pseudo-query for May signups
Tests cohort retention vs aggregate DAU and SQL self-joins for Week 1, 2, and 4 retention from May signups. Strong answers define cohorts by signup date, use datediff, and left-join activity. Red flag: using calendar week instead of relative signup date.

Describe client-side events and properties to track Export to CSV usage
This tests telemetry design for async actions. A strong answer defines three custom events—click, success, failure—with properties like location, file_size, error_code, and user_id, fired at the right lifecycle moments.

Design a near real-time pipeline to monitor orders per minute
Tests stream architecture and batch trade-offs. Outline: Kafka or Kinesis ingestion, Flink with tumbling windows, Druid or Pinot storage, Grafana alerts. Contrast batch on latency, exactly-once semantics, and cost. Red flag: calling cron SQL real-time.

Describe dbt's role and how it differs from traditional ETL
TESTS: Declarative warehouse transformation vs imperative ETL. OUTLINE: Position dbt as ELT's T with lineage, tests, docs; contrast with Python ETL using external compute and Airflow only scheduling tasks.

Describe tracking a user event end-to-end from frontend to BI tool
WHAT IT TESTS: Grasp of data pipeline layers from product to warehouse. ANSWER OUTLINE: Mention frontend instrumentation, routing, ingestion, warehouse transforms, and BI querying. RED FLAG: Stopping at the backend or confusing analytics with application logs.
Design an experiment and logging to link API latency to engagement
Causal inference and data integration. Randomly inject latency for a treatment group with a control at baseline, then join server trace IDs to client events via a shared request ID. Never confuse correlation with causation or miss join issues.
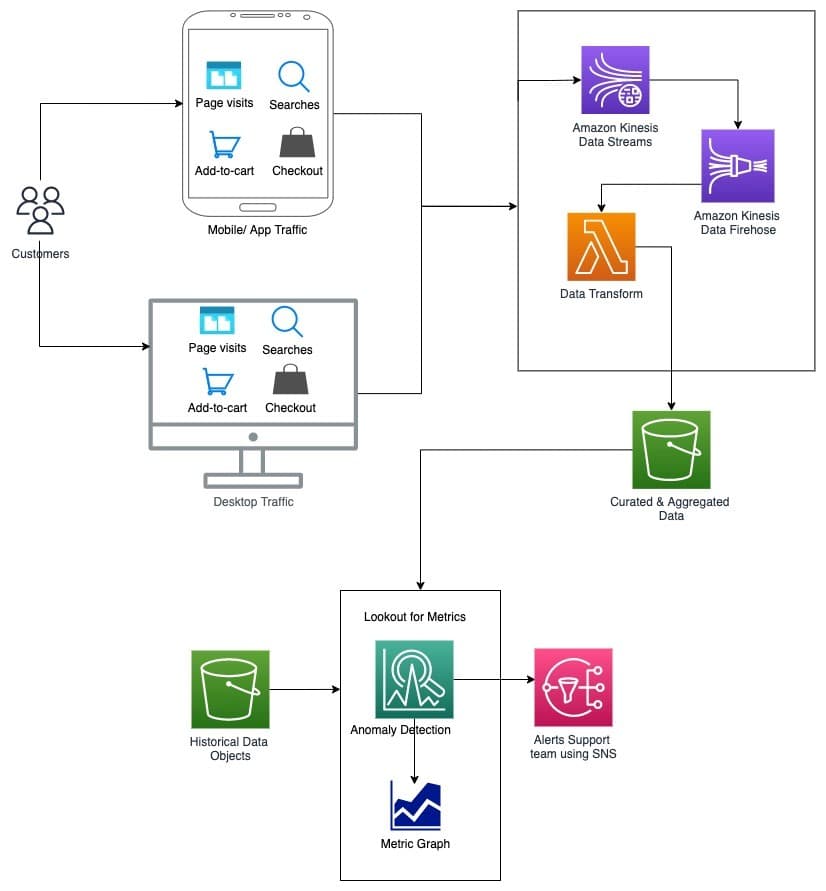
Design a system to detect sudden add-to-cart drops in real time
This tests streaming pipeline design and seasonality-aware anomaly detection. Outline Kafka or Kinesis ingestion, windowed aggregations, and ML baselines tuned to hourly and weekly trends. Red flag: static thresholds that ignore daily patterns.

Describe two methods for generating prediction intervals or probabilistic forecasts
Tests uncertainty quantification for risk-adjusted decisions. Strong answers: (1) parametric intervals via forecast error variance and normal multipliers, (2) bootstrap residual resampling for empirical percentiles.
Random split vs walk-forward validation in forecasting
WHAT IT TESTS: Awareness of temporal leakage. ANSWER OUTLINE: Random splits leak future data into training; walk-forward validation rolls the origin ahead, testing only on later observations. RED FLAG: Claiming random splits work for time-series.