Audio Spectrograms: Turning Sound into Images for AI
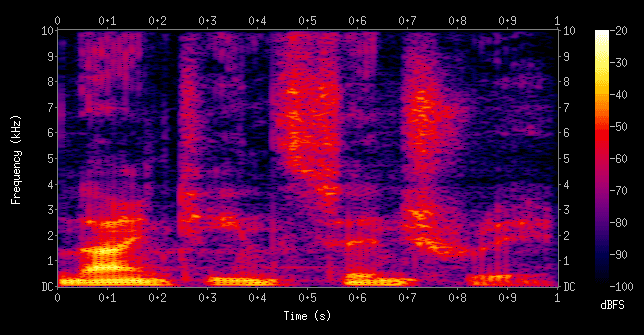
A spectrogram turns sound into an image, plotting frequency against time, with color showing intensity. This lets vision-based AI models "see" audio for tasks like speech recognition or music generation. The footgun is mistaking it for a simple waveform.
WHY IT EXISTS Raw audio waveforms are just a series of amplitude values over time. It's difficult for a machine to discern pitch, timbre, or speech from this one-dimensional data. We needed a way to represent the rich frequency information that our ears perceive but that is hidden in a simple waveform, making it suitable for analysis.
THE MENTAL MODEL Think of a spectrogram as sheet music for any sound, not just instruments. Time flows from left to right. But instead of discrete notes on a staff, the vertical axis shows a continuous spectrum of frequencies, from low to high. The "notes" are the bright spots on the graph, indicating which frequencies are loud at that specific moment in time.
HOW IT WORKS Creating a spectrogram involves breaking the audio signal into short, overlapping time chunks. Then, a mathematical operation called the Fast Fourier Transform (FFT) is applied to each chunk to determine the strength of every frequency present in it. Finally, these individual frequency snapshots are stacked side-by-side to form an image, with time on the x-axis, frequency on the y-axis, and amplitude (loudness) represented by color or brightness.
WHEN TO USE IT Use a spectrogram whenever you need to feed audio data into a model that excels at image processing, like a Convolutional Neural Network (CNN). This is the standard approach for audio classification (e.g., identifying a bird call), speech-to-text systems, speaker identification, and even music generation, where a model might learn to create a spectrogram that is then converted back into audio.
WHEN NOT TO USE IT For tasks where the precise timing of amplitude peaks is more important than frequency content, a raw waveform might be a better input. If your model architecture is specifically designed for 1D sequence data (like some RNNs or Transformers), converting to a 2D spectrogram might be an unnecessary and potentially lossy step. The conversion process itself also has parameters that can discard information if not set carefully.
ONE CANONICAL EXAMPLE In speech recognition, the sounds "s" and "sh" can look similar in a raw waveform. On a spectrogram, however, they are visually distinct. The "s" sound has its energy concentrated in very high frequencies. The "sh" sound's energy is spread across a broader, lower frequency band. This clear visual difference makes them much easier for a pattern-recognition model to distinguish.
Read the original → en.wikipedia.org
Get five bites like this every day.
Tezvyn delivers a daily feed of 60-second tech bites with quizzes to lock in what you learn.