BCG Growth-Share Matrix: A Map for Your Product Portfolio
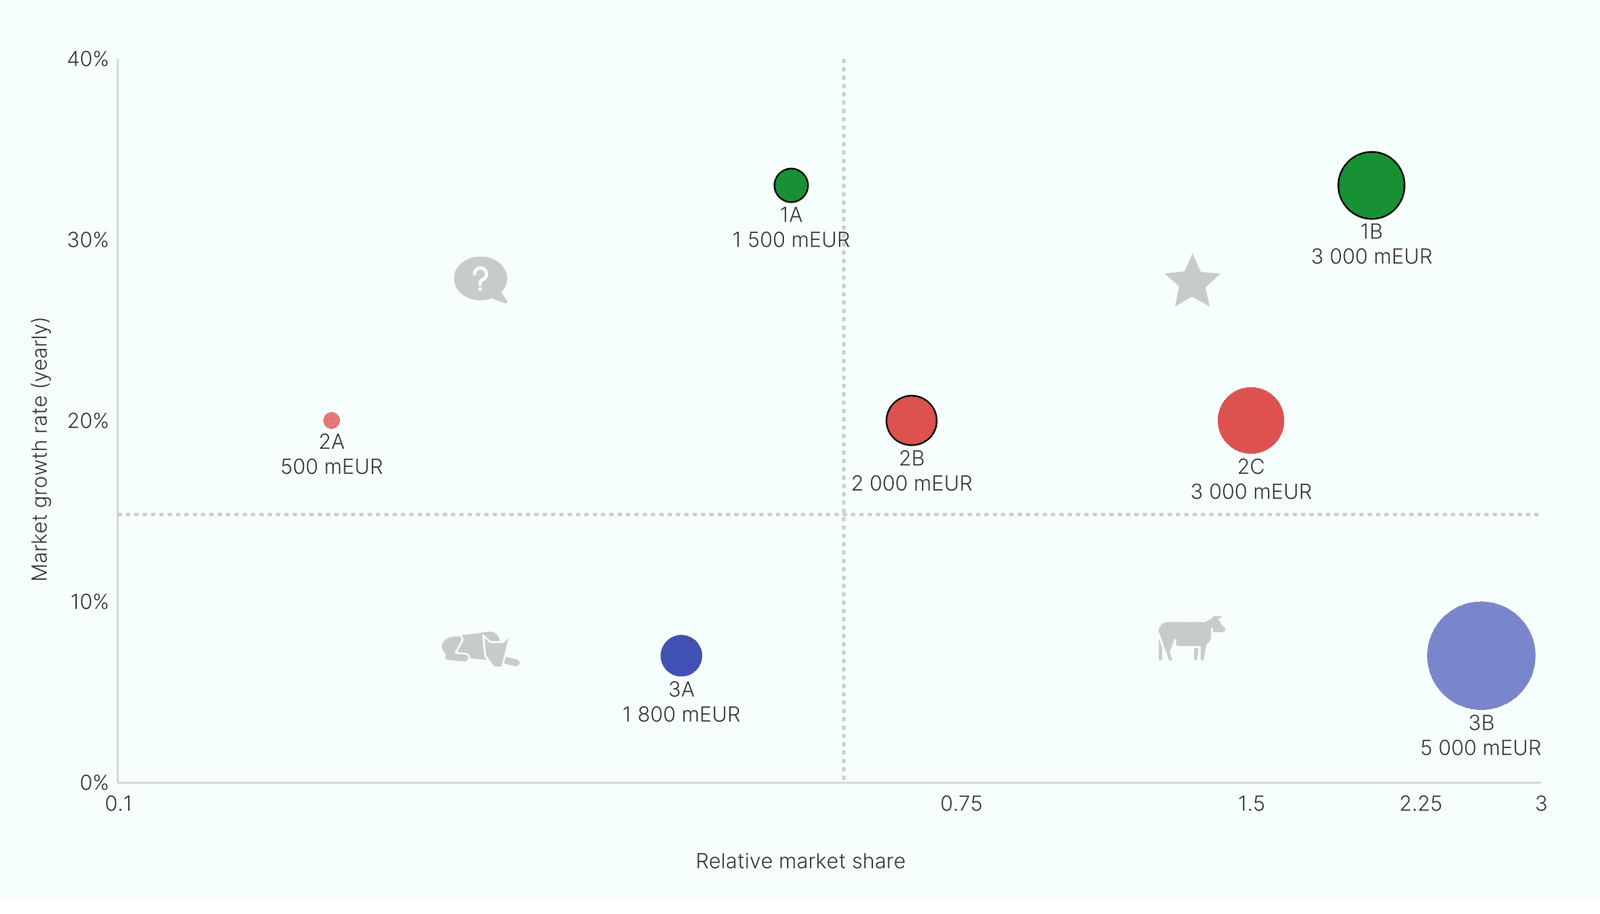
The BCG Matrix plots products on a 2x2 grid of market growth vs. market share to decide where to invest. It's used to categorize products as Stars, Cash Cows, Question Marks, or Dogs. The footgun is treating it as a static, predictive tool.
WHY IT EXISTS Companies with many products or business units need a simple way to decide which ones deserve more investment, which should be maintained for profit, and which should be divested. Without a framework, resource allocation can be driven by politics or emotion rather than strategy.
THE MENTAL MODEL Think of your business as a portfolio of products mapped on a four-quadrant grid. The vertical axis represents the market's growth rate (how fast the pie is getting bigger). The horizontal axis is your relative market share (how big your slice of the pie is). A product's position on this map suggests a specific strategy.
HOW IT WORKS The matrix defines four categories. First, 'Stars' are in high-growth markets where they have a high share; they require significant investment to maintain their trajectory. Second, 'Cash Cows' have a high share in low-growth markets; they are mature products that generate more cash than they need, which can fund other ventures. Third, 'Question Marks' (or 'Problem Children') have a low share in high-growth markets; they are gambles that could become Stars with investment or fail entirely. Fourth, 'Dogs' have a low share in a low-growth market; they typically generate minimal profit and are candidates for divestment.
WHEN TO USE IT Use this for high-level corporate strategy and portfolio management, especially in large, diversified companies. It provides a quick, visual way to assess the health and balance of a business unit portfolio and facilitates conversations about resource allocation.
WHEN NOT TO USE IT Do not use this as your only decision-making tool. The matrix is a simplification. It doesn't account for synergies between products (a 'Dog' might be essential for selling a 'Star'), the potential for niche markets, or how quickly a market's growth can change. Market share is not the only driver of profitability.
ONE CANONICAL EXAMPLE A large tech company might classify its new, rapidly-adopted AI service as a Question Mark, needing investment to capture share. Its established, dominant operating system is a Cash Cow, funding the AI venture. An older MP3 player is a Dog, facing discontinuation. Its leading cloud services platform is a Star, requiring constant investment to fend off competitors.
Read the original → en.wikipedia.org
Get five bites like this every day.
Tezvyn delivers a daily feed of 60-second tech bites with quizzes to lock in what you learn.