Data Aggregation: The Big Picture from Small Details
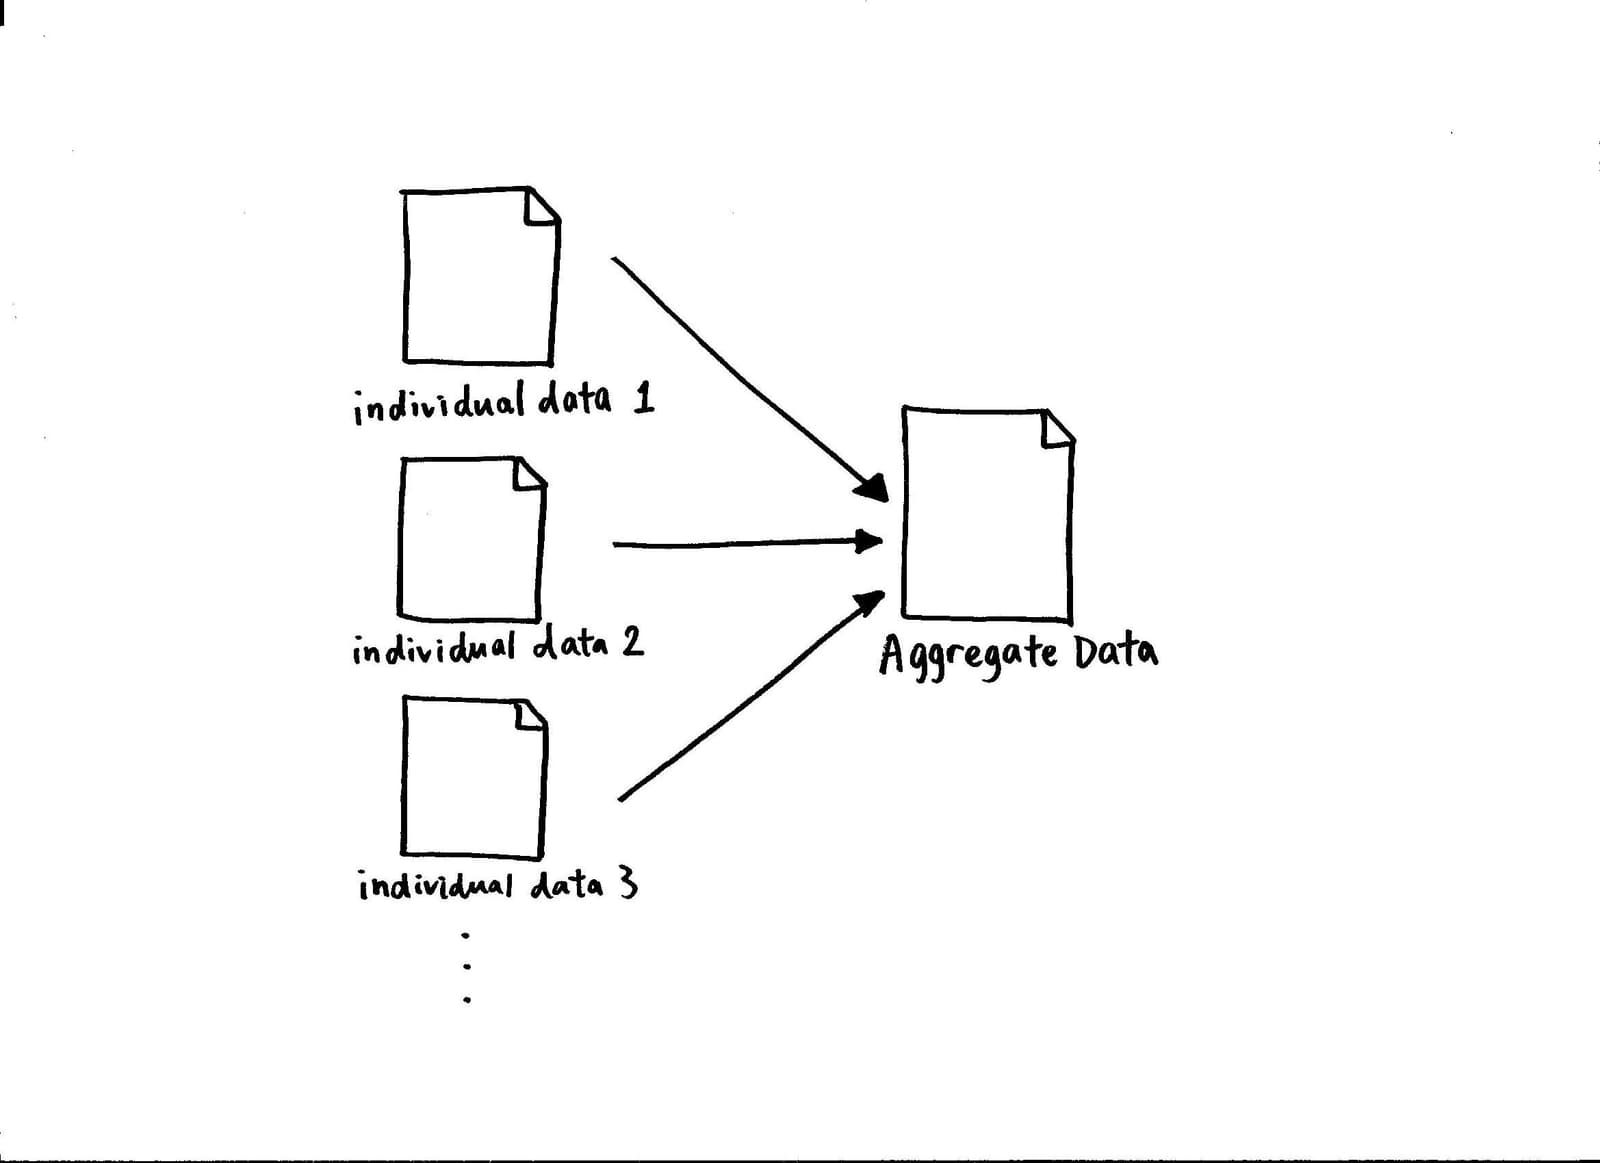
Data aggregation rolls up granular records into high-level summaries, like turning individual sales logs into a daily sales report. It's used to power dashboards and speed up warehouse queries.
THE MENTAL MODEL: Data aggregation is the process of rolling up fine-grained records into high-level summaries. Instead of looking at every single transaction from a coffee shop, you look at the total sales per hour or the average sale amount per store. You trade individual detail for a concise, big-picture view.
HOW IT WORKS: Aggregation combines a grouping key with an aggregation function. First, a dataset of individual records is grouped by a common attribute (e.g., user_id, product_category, or a time window like day). Then, a mathematical function like SUM(), COUNT(), AVG(), MIN(), or MAX() is applied to a field within each group, collapsing many rows into a single summary row. For example, you might GROUP BY store_id and SUM(sales).
WHEN TO USE IT: Aggregation is the backbone of business intelligence and analytics. First, for dashboards and reporting, to show key performance indicators (KPIs) like daily active users or total revenue. Second, for performance in data warehouses; systems pre-aggregate massive datasets into smaller summary tables, so queries for reports are fast and don't have to scan billions of raw events every time. Third, for privacy, by summarizing data to hide individual identities.
WHEN NOT TO USE IT: Avoid relying solely on aggregated data when you need to do root-cause analysis or debug a specific incident. Aggregation is a lossy process by design; you can't drill down into the individual events that produced the summary if you've discarded the raw data. If you see an anomaly in a daily summary, you need the raw, un-aggregated logs to find the cause.
ONE CANONICAL EXAMPLE: Imagine a table of raw sales data with columns for transaction_id, store_id, and sale_amount. It might have millions of rows like (1, 101, 12.50), (2, 102, 30.00), (3, 101, 8.00). To get total sales per store, you would aggregate this data. The resulting summary table would have just two rows: (101, 20.50) and (102, $30.00), making it much faster to query for store-level reports.
Read the original → en.wikipedia.org
Get five bites like this every day.
Tezvyn delivers a daily feed of 60-second tech bites with quizzes to lock in what you learn.