Exploratory Data Analysis (EDA): Look Before You Leap
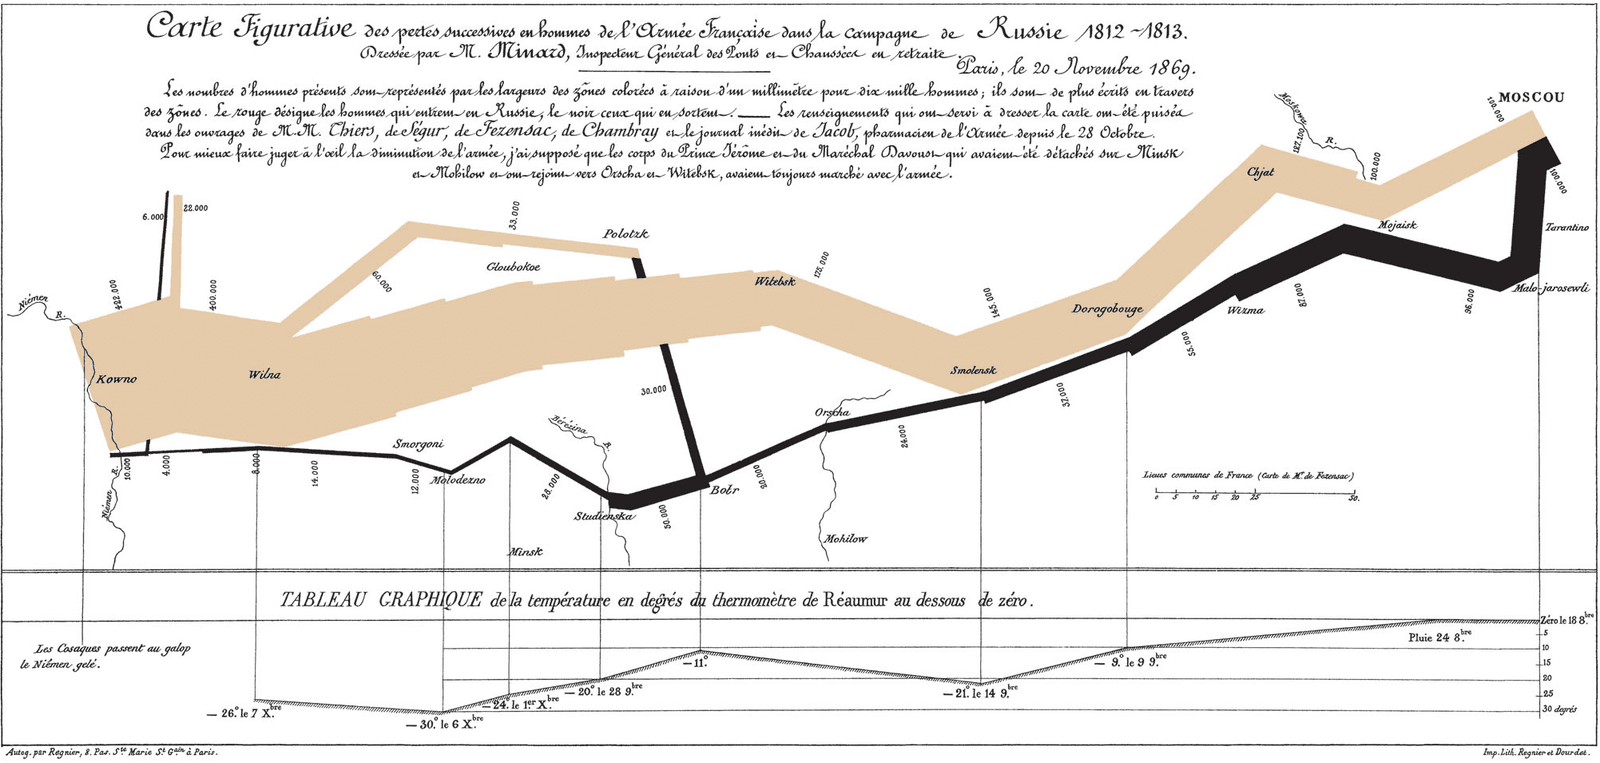
Exploratory Data Analysis (EDA) is like being a detective with your data: you look for clues, patterns, and outliers before forming a theory. It's the first step in any data project, from building a model to creating a dashboard.
THE MENTAL MODEL: Exploratory Data Analysis (EDA) is like being a detective at a crime scene. Instead of starting with a suspect and trying to prove their guilt (traditional hypothesis testing), you first survey the scene, gather clues, and look for patterns without any preconceived notions. It's an open-ended investigation to see what the data itself can tell you before you start building formal models or drawing firm conclusions.
HOW IT WORKS: EDA prioritizes curiosity and visual inspection over formal statistical modeling. The process involves using a variety of techniques to summarize a dataset's main characteristics. Common tools include statistical graphics like histograms to understand the distribution of a single variable, scatter plots to see the relationship between two variables, and box plots to identify outliers. You're also doing basic data cleaning and sense-checking, such as identifying missing values, understanding the data types of each column, and calculating summary statistics like mean, median, and standard deviation.
WHEN TO USE IT: EDA should be the first step in almost any project involving a dataset you haven't seen before. It's essential before building a machine learning model to understand feature distributions and relationships. It's also critical when preparing a business intelligence report to ensure you understand the context and potential pitfalls of the data. Essentially, any time you need to build intuition about a dataset and formulate hypotheses for further testing, you start with EDA.
WHEN NOT TO USE IT: EDA is not the right tool for making final, definitive conclusions. Because you are actively looking for patterns, you are likely to find some just by chance. Using the same data to both generate and test a hypothesis is a major statistical error. The insights from EDA are best used to formulate hypotheses that are then tested rigorously with new data or a separate, held-out test set. Think of it as the brainstorming phase, not the final peer review.
ONE CANONICAL EXAMPLE: Imagine a company gives you a dataset of user activity to understand engagement. Instead of immediately trying to build a predictive model, you start with EDA. You plot a histogram of daily logins and discover most users log in once, but a small group logs in over 20 times. You create a scatter plot of 'time spent in app' vs. 'account age' and find no clear correlation, debunking a common assumption. These initial findings, discovered through simple exploration, provide crucial context and guide the next steps of the analysis.
Read the original → en.wikipedia.org
Get five bites like this every day.
Tezvyn delivers a daily feed of 60-second tech bites with quizzes to lock in what you learn.