How do you determine A/B test sample size and duration?
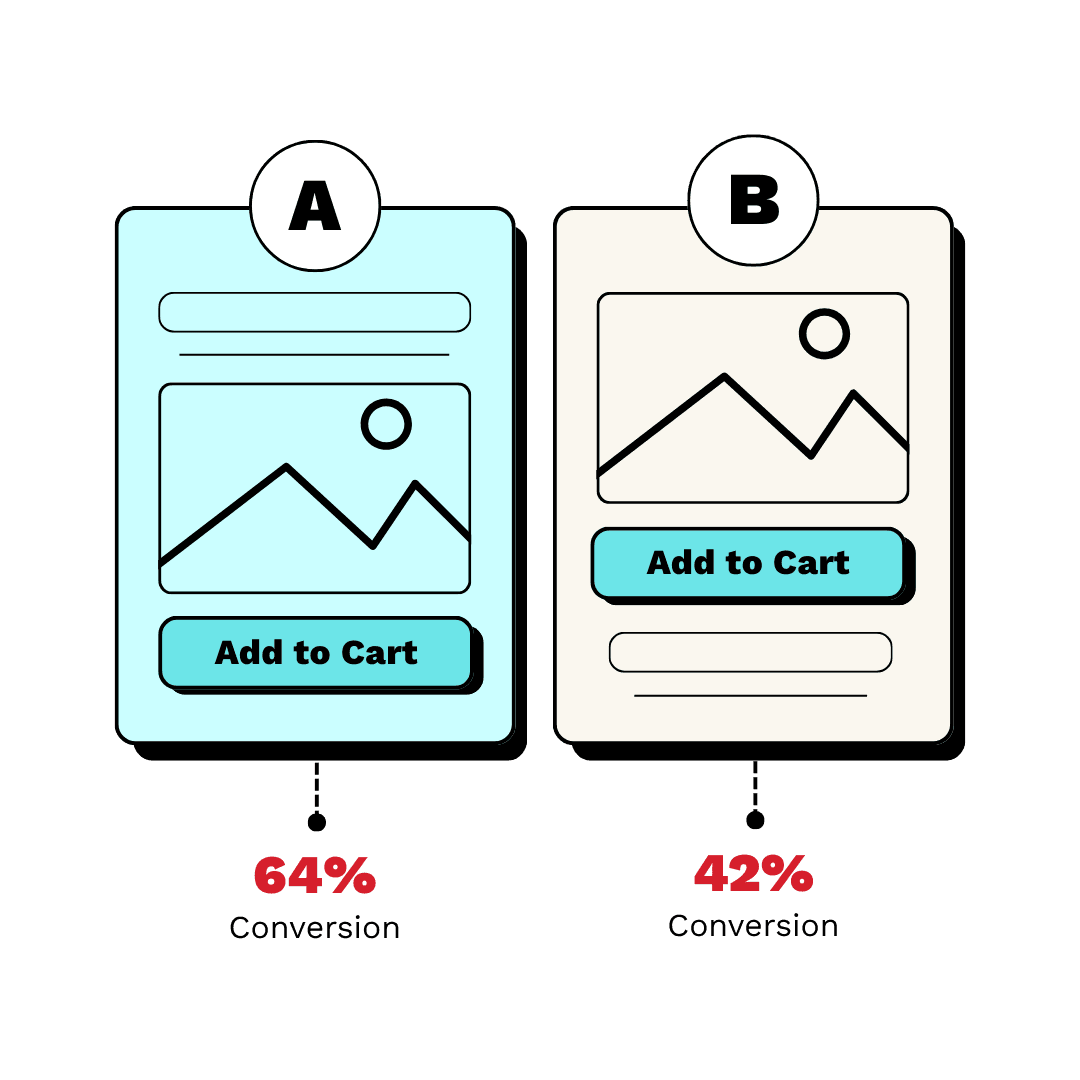
This tests your ability to connect business goals to statistical parameters. A good answer defines the four power analysis inputs (baseline, MDE, alpha, power) and explains trade-offs, then converts sample size to duration using business cycles.
WHAT THIS TESTS: This question tests your ability to translate business goals into statistical parameters. It's not a pure statistics quiz, but a test of your practical judgment in balancing speed, risk, and the cost of experimentation. The interviewer wants to see if you can have a pragmatic conversation about the trade-offs involved and justify your choices, especially for the Minimum Detectable Effect (MDE).
A GOOD ANSWER COVERS: First, the four core inputs for a power calculation. These are the baseline conversion rate (the current performance of the control), the Minimum Detectable Effect (the smallest lift you care about), the statistical significance level (alpha, typically 0.05), and the statistical power (1-beta, typically 0.8). Second, how to choose the MDE, explaining it's a business decision representing the smallest effect that is worth the effort of shipping. Third, the trade-offs: a smaller MDE, a lower baseline rate, or higher desired power all dramatically increase the required sample size. Fourth, how to convert sample size to duration by dividing the required sample size by the average daily traffic for the experiment, and crucially, the need to run for full business cycles (e.g., 1 or 2 weeks) to control for seasonality, even if the sample size is met sooner.
COMMON WRONG ANSWERS: Suggesting you should stop the test as soon as the p-value drops below 0.05. This is called 'peeking' and it dramatically increases the false positive rate. Another red flag is giving a generic duration like 'two weeks' without grounding it in a sample size calculation. A candidate who cannot clearly define MDE or explain that it's a business decision, not a statistical output, reveals a lack of practical experience. Finally, forgetting to mention the importance of running for full business cycles is a common omission.
LIKELY FOLLOW-UPS: What if you don't have enough traffic to detect a reasonable MDE in a timely manner? How does the MDE you choose affect engineering velocity? When would you choose a power of 90% instead of the standard 80%? These questions probe your understanding of the practical consequences and trade-offs of your decisions.
ONE CONCRETE EXAMPLE: For a checkout page with a 10% baseline conversion rate, we might decide the smallest lift we care about is a 5% relative improvement. This gives us an MDE of 0.5 percentage points (from 10% to 10.5%). Using a standard power of 80% and significance of 95% (alpha=0.05), an online calculator would tell us we need about 64,000 users per variant. If the page gets 20,000 users per day, we can run a 50/50 split with 10,000 users per variant per day. This means we'd need about 6.4 days to reach our sample size. To be safe and account for weekly patterns, we would run the test for 7 full days.
Read the original → cxl.com
Get five bites like this every day.
Tezvyn delivers a daily feed of 60-second tech bites with quizzes to lock in what you learn.