How would you analyze a time series of user sign-ups?
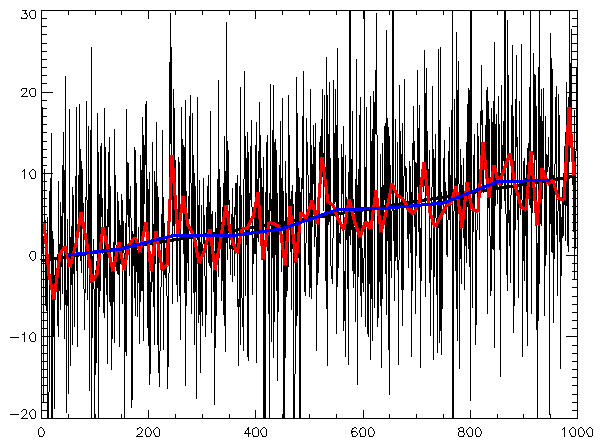
This tests your structured approach to decomposing time series data. A strong answer identifies trend (long-term growth), seasonality (weekly/yearly patterns), and irregular components like spikes or dips.
WHAT THIS TESTS: This question tests your ability to apply a structured, methodical approach to exploratory data analysis (EDA) for a time series. The interviewer wants to see if you can move beyond just plotting the data and instead decompose a signal into its constituent parts to understand the underlying business drivers. It's about turning raw numbers into a narrative about business performance.
A GOOD ANSWER COVERS: A strong answer discusses the classical decomposition of a time series into four key components. First, the Trend, which is the long-term direction of the data, indicating overall growth, decline, or stagnation. Second, Seasonality, which refers to predictable, fixed-period fluctuations, like weekly patterns (e.g., fewer sign-ups on weekends) or annual patterns (e.g., a dip during holidays). Third, Cyclical components, which are longer-term, non-seasonal fluctuations that may not have a fixed period, often tied to broader business or economic cycles. Finally, the Irregular or Residual component, which is the random noise or one-off events left after accounting for the other components, such as spikes from a marketing campaign or a dip from a service outage.
COMMON WRONG ANSWERS: The most common mistake is jumping straight to forecasting. Stating "I'd use a model like ARIMA or Prophet" misses the point of the question, which is about exploration, not prediction. Another red flag is giving a vague, unstructured answer like "I'd plot it and look for interesting patterns" without using the specific terminology of trend and seasonality. Finally, candidates often confuse seasonality (fixed period) with cycles (variable period).
LIKELY FOLLOW-UPS: Expect follow-ups like: "How would you statistically confirm the weekly seasonality you're seeing?" (Answer: Autocorrelation Function/ACF plot showing a spike at a lag of 7). Or, "You see a massive, one-day spike. How would you investigate its cause?" (Answer: Correlate it with other business data like marketing campaign launches, press releases, or engineering outage logs).
ONE CONCRETE EXAMPLE: For a three-year daily sign-up dataset, a concrete analysis would be: First, I'd calculate a 90-day moving average to visualize the Trend, which might show growth from 500 to 1,500 daily sign-ups over the period. Second, to find Seasonality, I'd plot the average sign-ups by day of the week, likely revealing 20-30% fewer sign-ups on weekends. I'd also check for annual patterns, like a consistent 15% drop in the last two weeks of December. Finally, I'd look for Irregularities by finding outliers. A single day with 10,000 sign-ups, when the average is 1,500, would be a key point to investigate, likely corresponding to a product launch or major press feature.
Read the original → en.wikipedia.org
Get five bites like this every day.
Tezvyn delivers a daily feed of 60-second tech bites with quizzes to lock in what you learn.