KPI Tree: Linking Product Changes to Business Outcomes
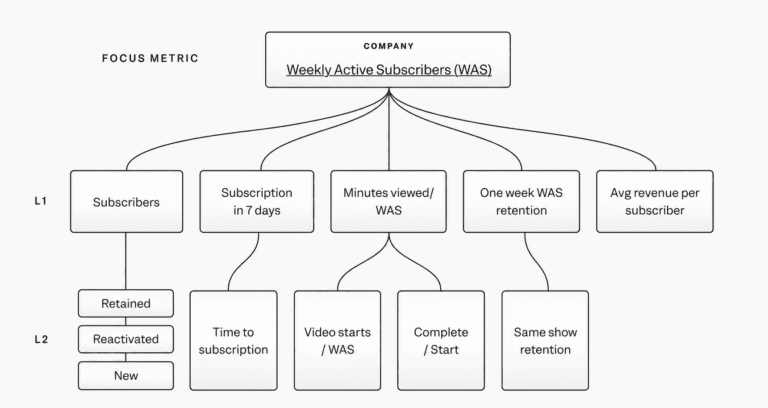
A KPI tree traces how changes ladder up to outcomes, giving metrics connective tissue. Build one when dashboards and experiments conflict and you need a defensible line from features to impact. Let it stay static and it becomes disconnected.
WHY IT EXISTS: Product managers juggle dashboards, user research, A/B test results, support tickets, and sales feedback every day. All that information rarely tells a single coherent story, which makes it difficult to draw a clear line from shipped experiments to the outcomes the business cares about. The metrics are not the problem. What is missing is the connective tissue that links day-to-day product changes to measurable business impact. A KPI tree provides that structure.
THE MENTAL MODEL: Think of a KPI tree as a living map of cause and effect. It arranges metrics so that user behavior and product decisions ladder up to business outcomes. Instead of viewing numbers as isolated dashboard widgets, you see them as linked steps in a chain where moving one metric should move another.
HOW IT WORKS: Teams map out user behavior and product decisions inside the tree to see how they connect to top-level goals. The structure starts with the business outcomes that matter most, then traces downward through the metrics that drive them, until you reach the experiments and user actions teams can actually influence. Because new features launch and user behavior evolves, the tree must be fed live data. Without it, the structure becomes a static canvas that disconnects from reality.
WHEN TO USE IT: Use a KPI tree when you need a coherent story across scattered metrics, when you must defend how a shipped experiment drove business impact, or when you want to align teams around how their work ladders up to shared outcomes. It is especially useful when product changes need to be traced to measurable results.
WHEN NOT TO USE IT: Do not use a KPI tree as a one-time diagram or dead dashboard. If it lacks live data and regular ritual, it will decay into another ignored artifact the moment behavior shifts. It is also a poor fit when you cannot establish a honest causal link between a metric and the outcome above it.
ONE CANONICAL EXAMPLE: A product team ships a redesigned onboarding flow. Without a KPI tree, they report trial signups, activation rates, and revenue in separate dashboards and struggle to show leadership exactly how the release moved the bottom line. With a KPI tree, they map the onboarding changes to activation rate, then show how activation ladders up to trial-to-paid conversion and ultimately net revenue retention. The tree turns a pile of disconnected numbers into a single defensible narrative.
Read the original → mixpanel.com
Get five bites like this every day.
Tezvyn delivers a daily feed of 60-second tech bites with quizzes to lock in what you learn.