Queueing Theory: The Math of Waiting Lines
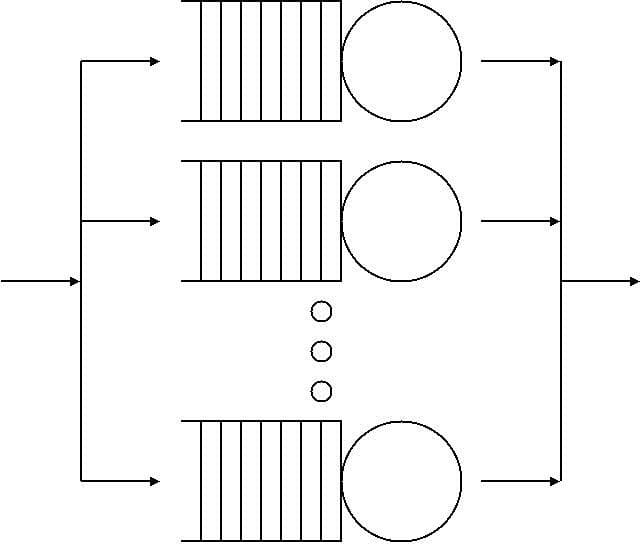
Queueing theory is the math of waiting lines, helping you predict system performance under load. It's used for capacity planning and setting autoscaling rules.
WHY IT EXISTS: Systems have finite resources like CPU, network bandwidth, or database connections. When requests arrive faster than they can be served, they must wait in a queue. Queueing theory was developed to mathematically model this waiting process, allowing us to predict performance and make informed decisions about resource allocation.
THE MENTAL MODEL: Think of a grocery store with a set number of cashiers. Customers arrive, wait in line, and get served. Queueing theory is the tool the store manager uses to decide how many cashiers to staff. Too few, and the lines become unacceptably long. Too many, and you're paying for idle workers. It's the formal study of this trade-off between service cost (servers) and waiting cost (latency).
HOW IT WORKS: The theory uses a few key variables: the arrival rate of requests (lambda, λ), the rate at which a single server can process requests (mu, μ), and the number of servers (c). These inputs are used in formulas to predict outputs like average queue length, average waiting time, and server utilization (rho, ρ). A key insight is the non-linear relationship between utilization and wait time. As utilization approaches 100%, wait times don't just increase—they skyrocket towards infinity.
WHEN TO USE IT: Use it for back-of-the-envelope capacity planning to answer questions like "how many more servers do we need for the holiday rush?" It's also the theoretical foundation for setting effective autoscaling policies (e.g., scaling up at 70% CPU, not 95%) and for sizing fixed resource pools like database connections or worker threads.
WHEN NOT TO USE IT: Do not rely on it for precise predictions in highly complex systems with many dependent services or non-random traffic patterns. The mathematical models make simplifying assumptions (like random arrivals) that reality often violates. For high-fidelity forecasts, use queueing theory to form a hypothesis, then validate it with direct load testing and observation.
ONE CANONICAL EXAMPLE: A single web server (c=1) can handle 100 requests/sec (μ). Requests arrive at 90/sec (λ). Utilization ρ = λ/μ = 0.9 or 90%. The average time a request spends in the system (waiting + being served) is (1/μ) / (1-ρ) = (1/100) / (1-0.9) = 0.1 seconds. If traffic increases just 5% to 95 requests/sec, utilization becomes 95%. The average time in system jumps to (1/100) / (1-0.95) = 0.2 seconds. A tiny increase in load caused a 2x increase in latency, demonstrating the exponential penalty of high utilization.
Read the original → en.wikipedia.org
Get five bites like this every day.
Tezvyn delivers a daily feed of 60-second tech bites with quizzes to lock in what you learn.