Regression Analysis: Finding the Line of Best Fit
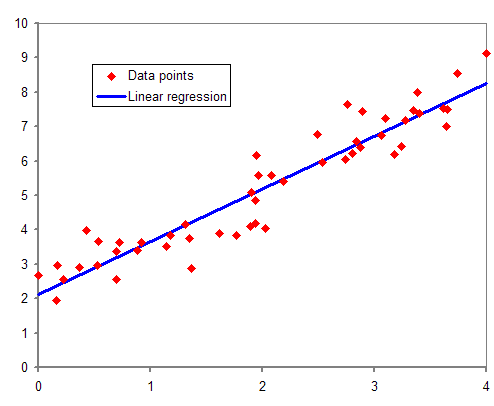
Regression analysis draws a line through data to model relationships between variables. Use it to predict a house price from its square footage or forecast sales from ad spend. The footgun: a strong correlation doesn't prove one variable causes the other.
THE MENTAL MODEL: Imagine a scatter plot of data points, like house prices versus square footage. Regression analysis draws the one 'line of best fit' through that cloud of points. This line is a mathematical formula that describes the relationship, answering questions like, 'For every extra 100 square feet, how much does the price increase on average?' It turns a messy cloud of data into a predictive model.
HOW IT WORKS: The most common method is Ordinary Least Squares (OLS). For any potential line drawn through the data, you can measure the vertical distance from each data point to the line. This distance is the 'error' or 'residual'. OLS squares each of these error values (to make them positive and penalize large errors more heavily) and then sums them up. The regression algorithm finds the exact slope and intercept for the line that makes this total sum of squared errors as small as possible. The output is an equation, like Price = (Slope * Square_Footage) + Intercept, that you can use for predictions.
WHEN TO USE IT: Use regression when you need to predict a continuous numerical value (the dependent variable) based on one or more other variables (the independent variables). Three common uses are: first, forecasting future values like company revenue based on past performance; second, quantifying the impact of one variable on another, like how ad spend affects website traffic; third, understanding relationships in data, such as how hours of study relate to final exam scores.
WHEN NOT TO USE IT: Regression is not for classification problems, where the outcome is a category (e.g., 'spam' or 'not spam'). Use a technique like logistic regression for that. It's also unreliable if the underlying relationship isn't linear (and you're using a simple linear model), if your dataset is very small, or if your independent variables are highly correlated with each other (a problem called multicollinearity).
ONE CANONICAL EXAMPLE: Predicting house prices. The dependent variable is 'price', and an independent variable is 'square_footage'. You gather data on 100 recent home sales. Regression analysis might produce the formula: Price = (250 * square_footage) + 40,000. This model suggests that, on average, each additional square foot adds 250 to a home's price, with a baseline value of 40,000. You could then predict that a 2,000 sq. ft. house would cost around $540,000.
Read the original → en.wikipedia.org
Get five bites like this every day.
Tezvyn delivers a daily feed of 60-second tech bites with quizzes to lock in what you learn.