
Causal Language Modeling: The Autocomplete Engine
Causal Language Modeling is like a powerful autocomplete, predicting the next word based only on what came before. It's the engine for text generation in chatbots, creative writing tools, and coding assistants. The footgun: it can't see future words.

Transformer Preprocessing: From Text to Tensors
Transformers don't read text; they read numbers. A tokenizer is the translator, converting sentences into numerical tensors the model understands. This is the mandatory first step for any NLP task. The footgun is using a tokenizer that doesn't match the model.

How a SQL SELECT Query Actually Runs
A SQL SELECT query runs in a different order than you write it. It first builds the dataset with FROM/JOINs and filters it with WHERE, only then computing the final columns in SELECT. This is crucial for debugging.

Dashboard Design: Guide, Don't Overwhelm
A good dashboard guides users to an insight, not just displays charts. Place your key takeaway in the top-left and limit views to 2-3 to maintain focus. The biggest mistake is including too many views, which clutters the message and slows down the dashboard.

Data Pipeline Orchestration: Beyond Cron Jobs
Data pipeline orchestration is the conductor for your data workflows, ensuring tasks run in the right order with full dependency awareness. It manages complex chains, like triggering analytics only after an ETL job succeeds.
Idempotency: Making Data Pipelines Retry-Safe
Idempotency means an operation has the same effect whether run once or multiple times, like closing an already-closed door. It's essential for data pipelines where retries are common. The footgun is assuming retries are safe, leading to data corruption.

Cython: Static Typing for Faster Python
Cython speeds up Python by compiling it to C, especially when you add static types to bypass Python's dynamic overhead. Use it for CPU-bound bottlenecks like tight loops in numerical code.

Proxy Metrics: Estimate Long-Term Impact Now
A proxy metric uses a model to estimate a slow, long-term outcome, like annual revenue. It lets you quickly judge an A/B test's impact without waiting months for the true result. The footgun is trusting a biased model or ignoring its error, giving you false.
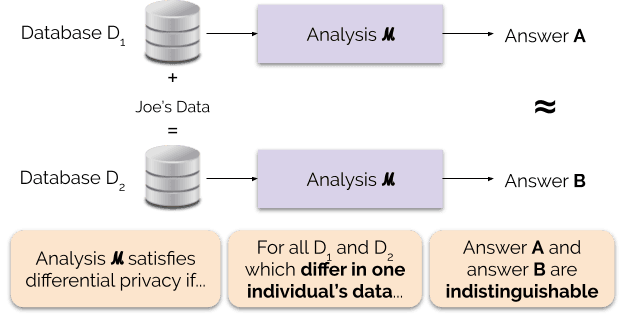
Differential Privacy: Anonymize Data with Math
Differential Privacy adds mathematical noise to data queries, making it impossible to know if one person's data is included. Tech giants use it to learn from user behavior without seeing individual activity.

AI Accountability: Who's Responsible When AI Fails?
AI accountability means someone is answerable for an AI's actions. It requires organizations to manage risks and trace decisions throughout the AI's lifecycle, ensuring systems function properly and align with human-centric values.

Model Monitoring: A Health Check for Production AI
Model monitoring is a smoke detector for your AI, alerting you when its performance degrades. It compares live data to training data to catch data drift or shifts in user behavior. The footgun is assuming a model, once deployed, performs well forever.

Model Cards: The Nutrition Label for AI
A Model Card is a nutrition label for an ML model, detailing its performance, biases, and intended use. It's vital for high-stakes systems to ensure fairness, like in health or legal predictions. The footgun is deploying a model without one, risking misuse.

Model Versioning: Git for Your ML Models
Think of model versioning as "Git for data." It tracks large models and datasets alongside your code without bloating your Git repo. Use it to reproduce old experiments or roll back to a better-performing model. The footgun is versioning only code, not data.

Data Storytelling: Using Narrative to Drive Insight
Structure your data presentation like a story—a journey with rising tension and a clear resolution. This guides stakeholders from a problem to a solution in reports.
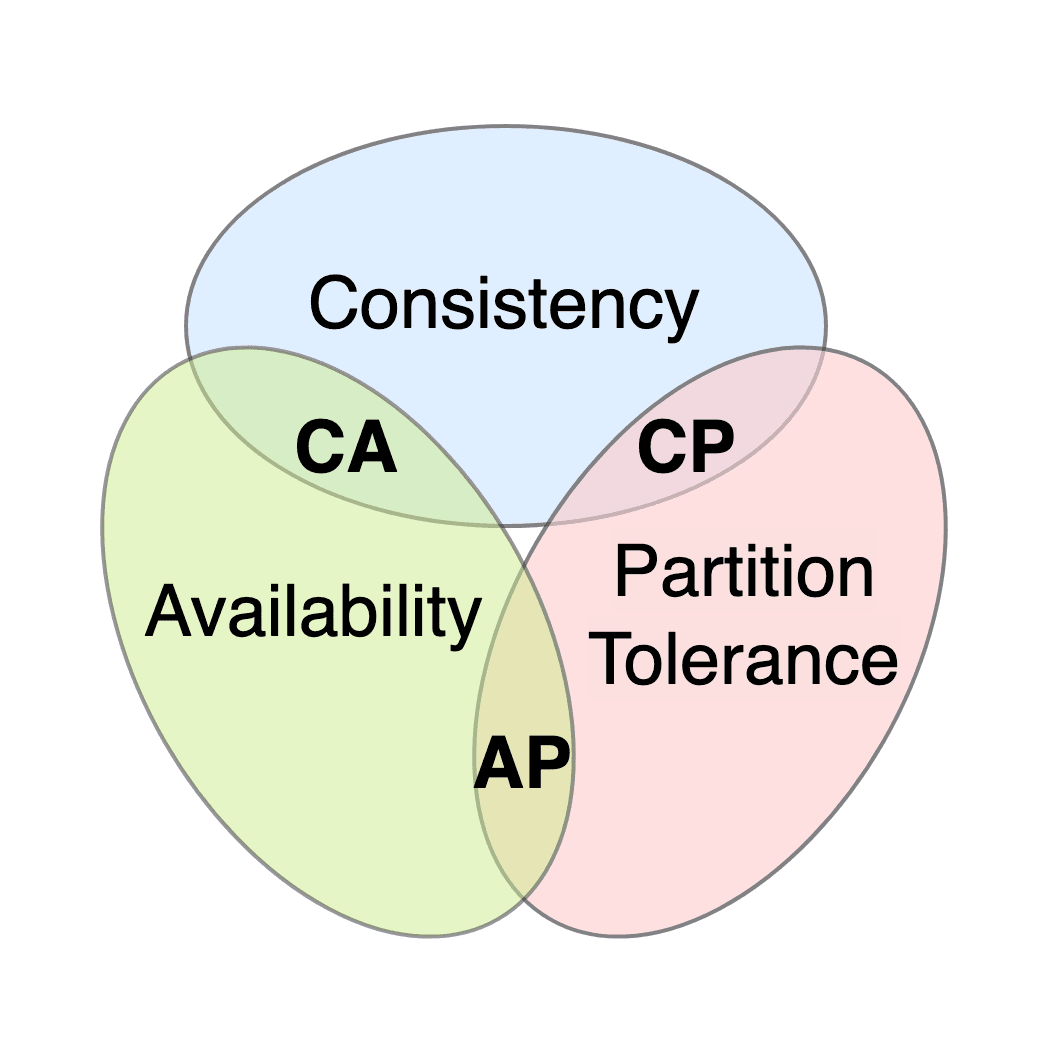
CAP Theorem: Pick Two of Three Guarantees
The CAP Theorem states a distributed system can only have two of three guarantees: Consistency, Availability, or Partition Tolerance. When the network fails (a partition), you must choose: stop responding to ensure data is consistent (CP) or keep responding…
Spark RDDs: Immutable, Distributed Data Collections
An RDD is Spark's core abstraction: an immutable, partitioned collection of items processed in parallel. It's the go-to for low-level, unstructured data tasks. The main footgun is using RDDs when higher-level DataFrames offer better performance.

Transfer Learning: Don't Train Models from Scratch
Transfer learning means not training a model from zero. You start with a model pre-trained on a large, general dataset, then fine-tune it for your specific task. This is common in image recognition, using a general model to learn a niche classification.
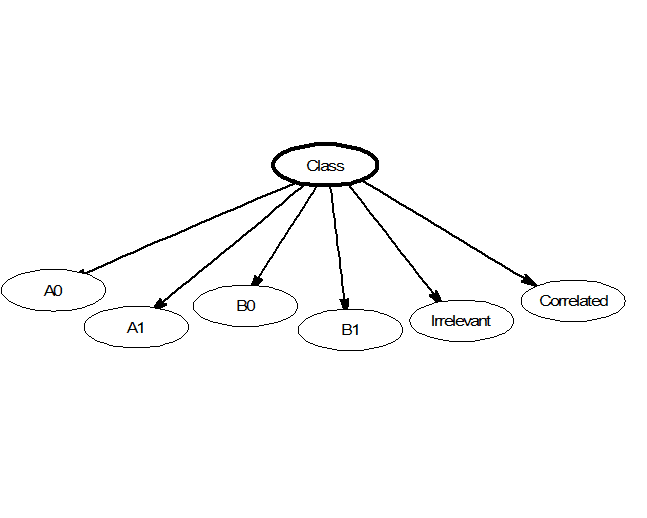
Naive Bayes: Fast Classification by Assuming Independence
Naive Bayes classifies data by assuming its features are unrelated, like judging a fruit's type by color and shape independently. This makes it fast for tasks like spam filtering or real-time predictions. Its core 'naive' assumption is almost always wrong.
Cross-Validation: Don't Test on Your Training Data
Cross-validation stops a model from 'cheating' by testing it on unseen data. It repeatedly splits your dataset into training and testing portions to simulate real-world performance.
Facet Grid: A Visual GROUP BY for Your Data
A Facet Grid is a visual GROUP BY. It creates a matrix of plots, each showing a different subset of your data, to compare relationships across categories. The footgun is forgetting to call `.map()` to draw the plots; the grid is empty on its own.