Everything in Product Management, page 6
Trace an event from click to analysis
Client SDK captures and batches, a collection endpoint ingests, a stream and ETL enrich and load into a warehouse for analysis.
Communicate forecast uncertainty with prediction intervals
A point estimate hides risk; produce a prediction interval via model error, simulation, or scenarios, and state assumptions.
When user-level A/B tests get contaminated
Network or marketplace spillover violates SUTVA, so randomize by cluster (geo, group, time) and analyze at that level.
Build an opportunity-sizing model before building
Locate the affected funnel step, estimate addressable population times a bounded conversion lift times value per user, then sanity-check against a realistic ceiling.
Combine qualitative and quantitative data for hypotheses
Quant reveals what and where, qual reveals why, then triangulate into a falsifiable hypothesis with a metric.
Explain RICE scoring and its Confidence factor
Score equals Reach times Impact times Confidence divided by Effort; Confidence discounts uncertain estimates; ground it in evidence tiers.
Instrument a first-full-song activation event
Define 'full song' server-side, emit a typed event with user, song, and context, dedupe the first-time flag.
Architect an experimentation dashboard for culture
Searchable experiment repository, structured hypotheses, results regardless of outcome, and cross-team discovery.
Resurrection Campaign
A resurrection campaign is a targeted effort to win back dormant or churned users by re-engaging them with relevant value, often via email or push. It matters because reactivating known users is usually cheaper than acquiring new ones.
Stationarity in time series and why ARIMA needs it
Constant mean/variance/autocovariance; ARIMA's coefficients assume them; test with the ADF test and ACF plots; achieve it via differencing or log transforms.
Pushing back on a costly, low-value feature
Estimate cost in engineer-weeks, size the expected value, frame it as cost-per-unit-of-value, then propose a cheap experiment to test the hypothesis first.
Why the Sprint is a 'container' for empiricism
A steady cadence creates regular inspection points, the Sprint Goal stays fixed once committed, and Developers are shielded from scope churn.

Describe the architecture of a generic A/B testing framework
Hash-based user bucketing, config service, pre-registered metrics, and confidence intervals on dashboards.
Explain event schemas and why schema registries matter at scale
This tests schema evolution and data contracts in distributed systems. A good answer defines schemas as contracts, explains that a registry enforces compatibility to block breaks, and lists pain like pipeline failures. Never treat schemas as optional docs.
How would you instrument and query P95 API latency by region?
This tests white-box latency instrumentation and safe cardinality for percentile aggregation. Strong answer: emit histograms by region, query P95 with histogram_quantile or a log percentile, and keep trace IDs in logs only.

Which classical baseline model handles weekly seasonality and upward trend?
Tests matching model structure to data characteristics. Name Holt-Winters triple exponential smoothing; map its level, trend, and seasonal equations to weekly period. Red flag: jumping to SARIMA without explaining why ETS is the natural baseline.
How do you measure forecast accuracy and compare MAE to RMSE?
This tests out-of-sample validation and how MAE and RMSE weight errors. A strong answer demands a train-test split, defines both, and notes RMSE punishes outliers more while MAE is more robust. A red flag is citing in-sample fit instead of held-out error.
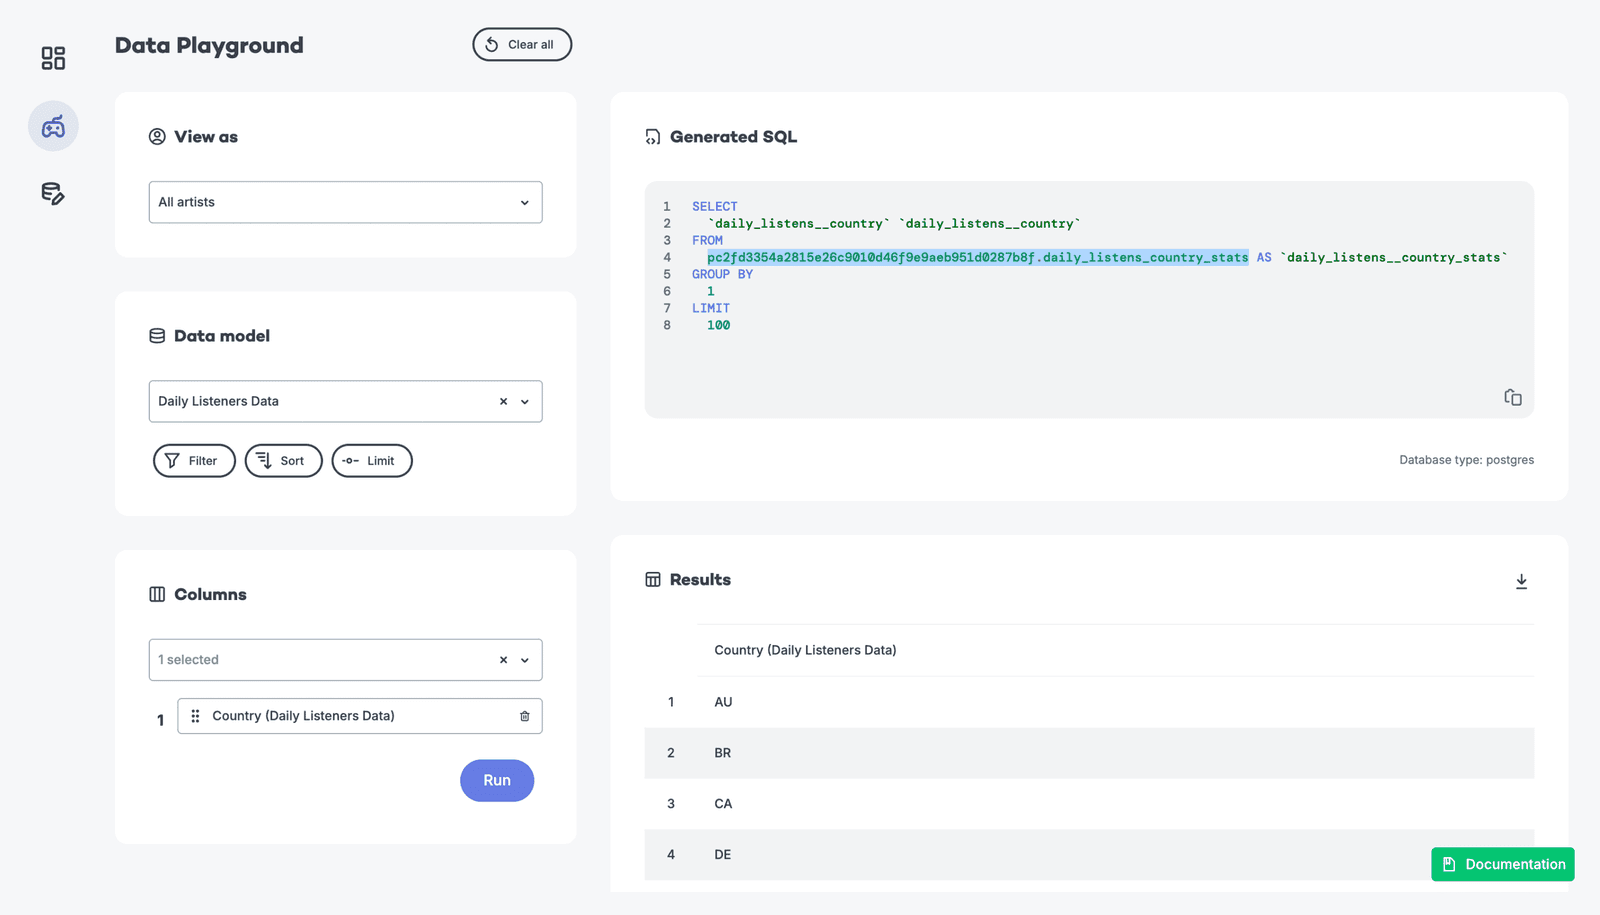
Trade-offs between pre-aggregated and raw event data for dashboards
Pre-aggregations trade freshness for speed; raw queries preserve flexibility but spike cost and latency under load.
Compare data warehouses and data lakes. How does a lakehouse merge benefits?
Tests schema tradeoffs. Warehouses enforce ACID for BI but cost more; lakes store raw cheaply but lack governance. Lakehouses add ACID metadata on object storage to unify ML and BI.

Propose a North Star Metric for a product you know
Definition; your product's metric; how value drives retention and revenue.
We are hiring for this. Every open role lists the topics its interview covers, so you can prepare for the real thing rather than guessing.
See open roles