
How do you instrument client and server to debug payment drop-offs?
Tests designing telemetry that distinguishes intent from errors across the stack. Strong answers use visibility pings for abandonment, validation events for client errors, and gateway status codes for backend failures.

Propose a strategy to enforce a consistent analytics event schema
WHAT IT TESTS: scalable data governance preventing schema drift across teams. ANSWER: schema registry with CI validation, typed SDK wrappers blocking bad builds, plus ingestion-time rejection. RED FLAG: docs or manual reviews without automated guardrails.

Describe the SQL and data model for weekly cohort retention
WHAT IT TESTS: Anchoring activity to signup cohort. ANSWER OUTLINE: Join users and activity, compute week offset per user, group by cohort and offset for retention. RED FLAG: Counting active users globally without cohort anchoring.
How do you track events and calculate funnel drop-off?
Tests event mapping and funnel math. Answer: one event per step (page view, email submit, profile done); compute relative step conversion and overall rate from top; deduplicate users. Red flag: raw pageviews instead of uniques.

How would you architect long-term holdback experiment groups?
Tests longitudinal causal inference and engineering tradeoffs for multi-month isolation. A strong answer covers bucketing, delayed metrics, and cross-experiment guards. Red flag: daily re-randomization or ignoring survivorship bias in aging cohorts.
How would you structure an event schema for funnel and cohort analysis?
This tests analytical event modeling. Use an immutable log with one row per event; attach context user_id, session_id, campaign; use a wide atomic table plus extensible contexts for funnel and cohort queries without joins.
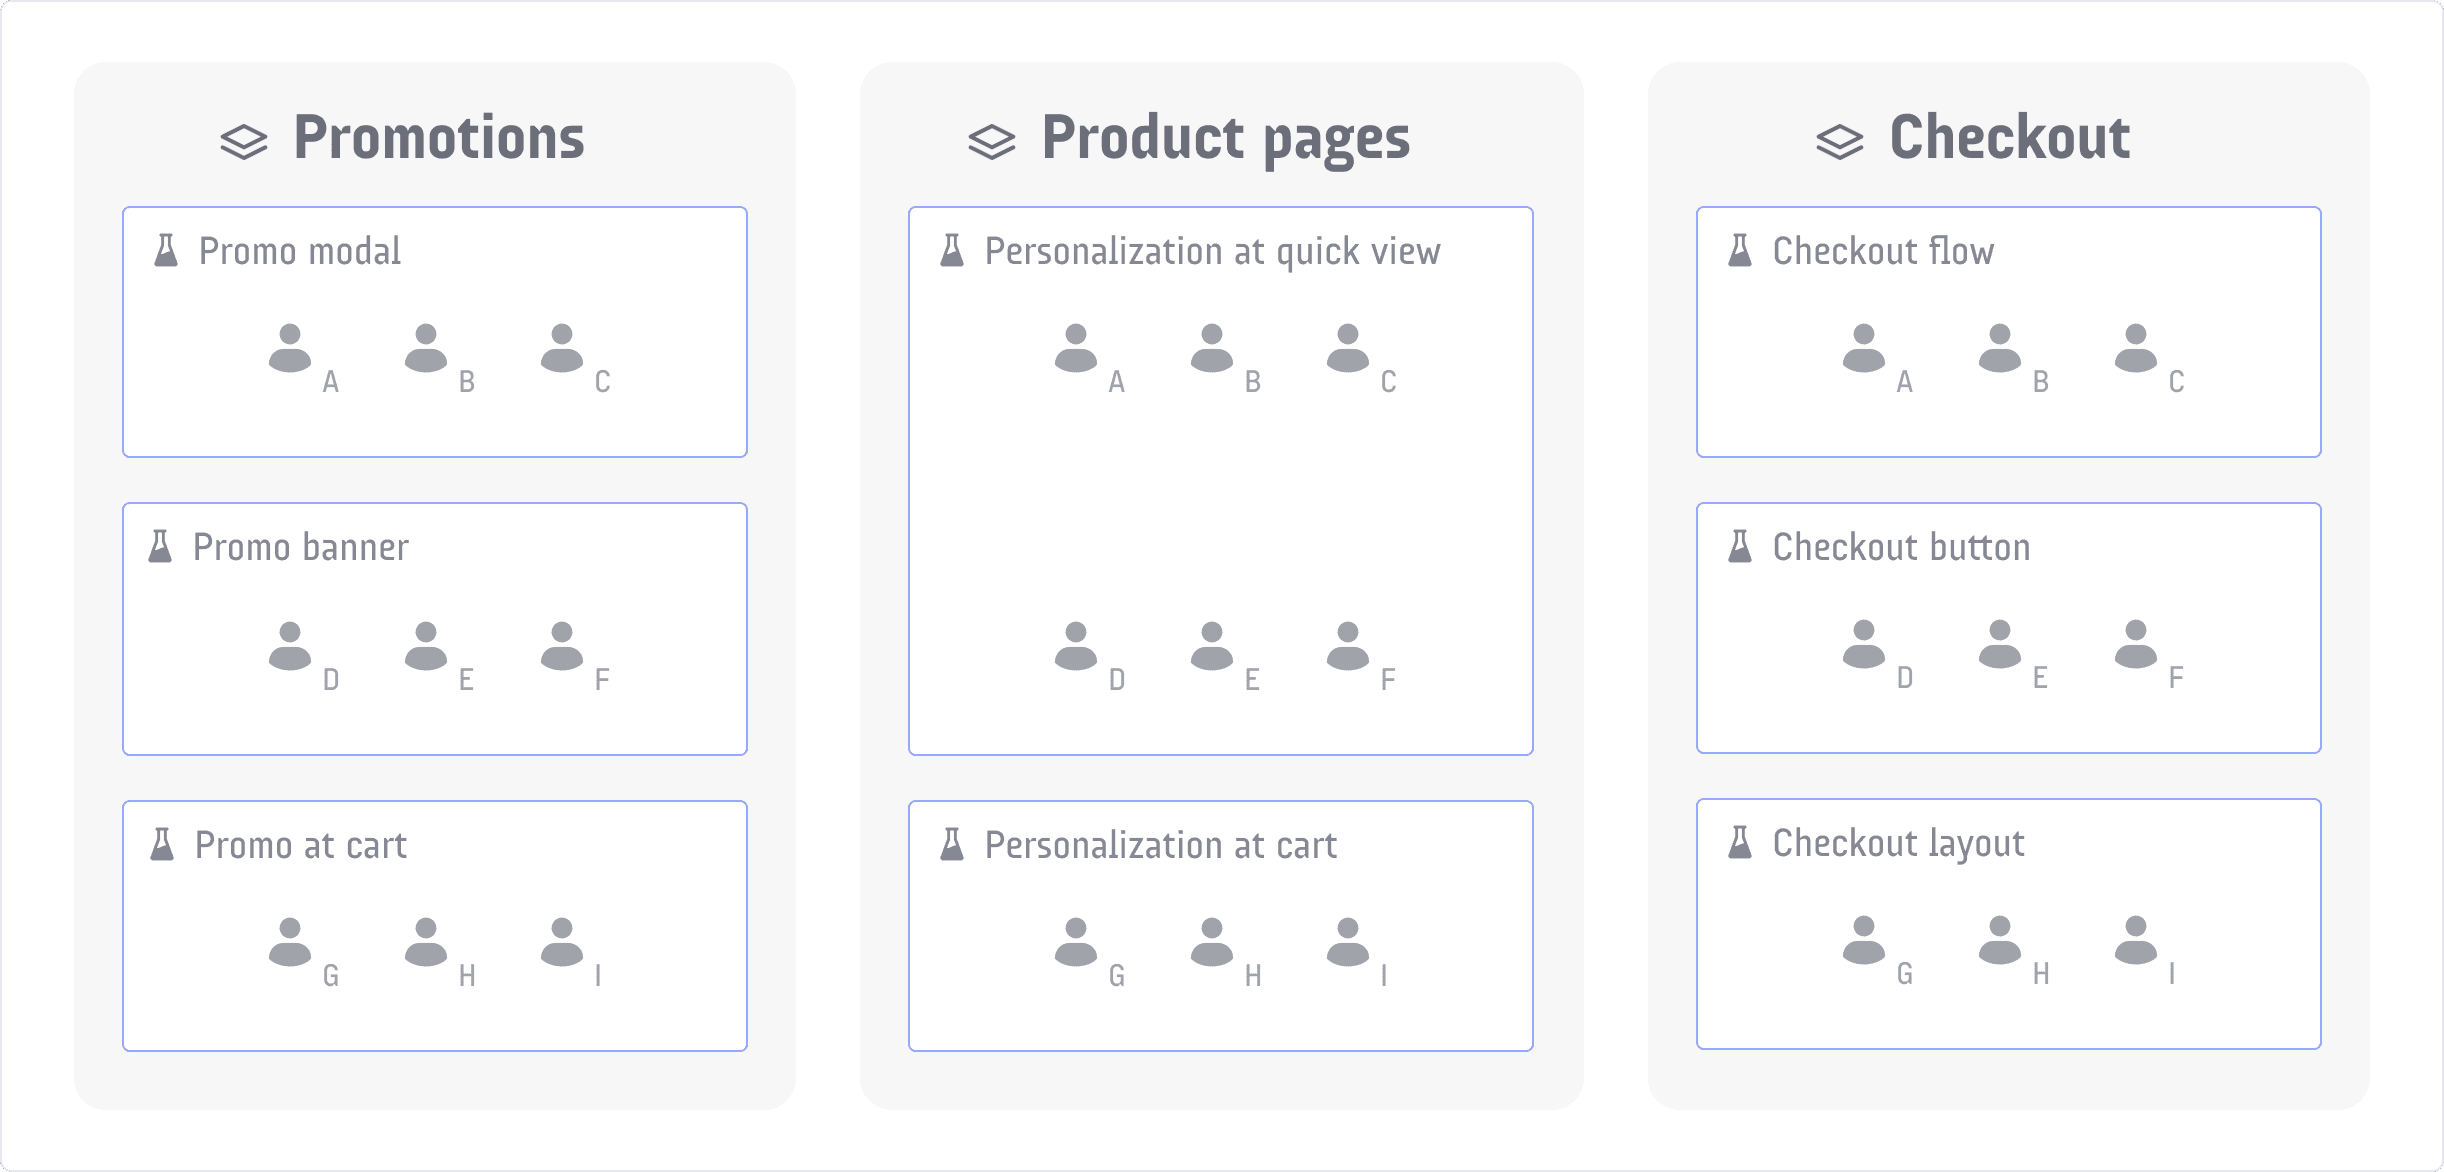
How do you design allocation logic to minimize concurrent A/B test interactions?
WHAT IT TESTS: Designing allocation to isolate concurrent experiments. ANSWER OUTLINE: Compare mutual exclusion with layered randomization via layers and reservations; stress isolation vs throughput.

Describe RICE scoring and architect data pipelines for Reach and Effort
WHAT IT TESTS: Bridging prioritization and data systems for Reach and Effort. ANSWER OUTLINE: Define RICE; automate Reach via event streams with time windows; automate Effort from PM tool estimates with calibration.

How do you instrument a marketing funnel versus a product-led growth loop?
This tests if you distinguish linear attribution from compounding systems. A strong answer contrasts stage-tracking and CAC with viral-coefficient instrumentation, cycle-time velocity, plus identity resolution.

What counter metrics track health of weekly active users?
Tests whether you can spot growth-at-all-costs blind spots. A strong answer pairs WAU with 7-day retention, sessions per user, and error rate, mapping each to churn, shallow engagement, or bugginess.

Apply AARRR to B2B SaaS vs B2C mobile game analytics
This tests mapping AARRR to instrumentation across business models. A strong answer contrasts B2B account activation and expansion against B2C session-zero funnels and whale monetization. Red flag: same metrics ignoring account hierarchies and ad attribution.
What is the difference between a metric and a KPI?
Tests strategic vs operational measurement discernment. Answer: KPIs track critical goals; metrics track processes. Page views are a metric; conversion rate is the KPI. Red flag: calling all data KPIs or using page views as success proof.

How do you root-cause a 20% revenue drop with no pipeline failures?
WHAT IT TESTS: Incident leadership and validating data integrity before calling a downturn. ANSWER OUTLINE: Reconcile against raw events, slice by dimension for silent gaps, audit schema drift.

Propose a technical architecture for a centralized Metrics Layer or Metrics Store
This tests your ability to decouple metric semantics from storage and query tools. A strong answer outlines a semantic layer with versioned definitions, a query API, and enforced downstream consumption.
Design a real-time mobile analytics pipeline
Tests decoupling high-volume ingestion from low-latency querying. Strong designs use an event broker, a stream processor for windowed aggregates, and an OLAP database for sub-second dashboards.

Design a data model for feature adoption tracking
Tests dimensional modeling for high-volume events so PMs can query Feature A not B without complex SQL. A strong answer uses an event fact table plus a materialized user-feature summary. Red flag: a wide user table with boolean columns per feature.
Explain cohort retention and write a pseudo-query for May signups
Tests cohort retention vs aggregate DAU and SQL self-joins for Week 1, 2, and 4 retention from May signups. Strong answers define cohorts by signup date, use datediff, and left-join activity. Red flag: using calendar week instead of relative signup date.

Describe client-side events and properties to track Export to CSV usage
This tests telemetry design for async actions. A strong answer defines three custom events—click, success, failure—with properties like location, file_size, error_code, and user_id, fired at the right lifecycle moments.

Design a near real-time pipeline to monitor orders per minute
Tests stream architecture and batch trade-offs. Outline: Kafka or Kinesis ingestion, Flink with tumbling windows, Druid or Pinot storage, Grafana alerts. Contrast batch on latency, exactly-once semantics, and cost. Red flag: calling cron SQL real-time.

Describe dbt's role and how it differs from traditional ETL
TESTS: Declarative warehouse transformation vs imperative ETL. OUTLINE: Position dbt as ELT's T with lineage, tests, docs; contrast with Python ETL using external compute and Airflow only scheduling tasks.