
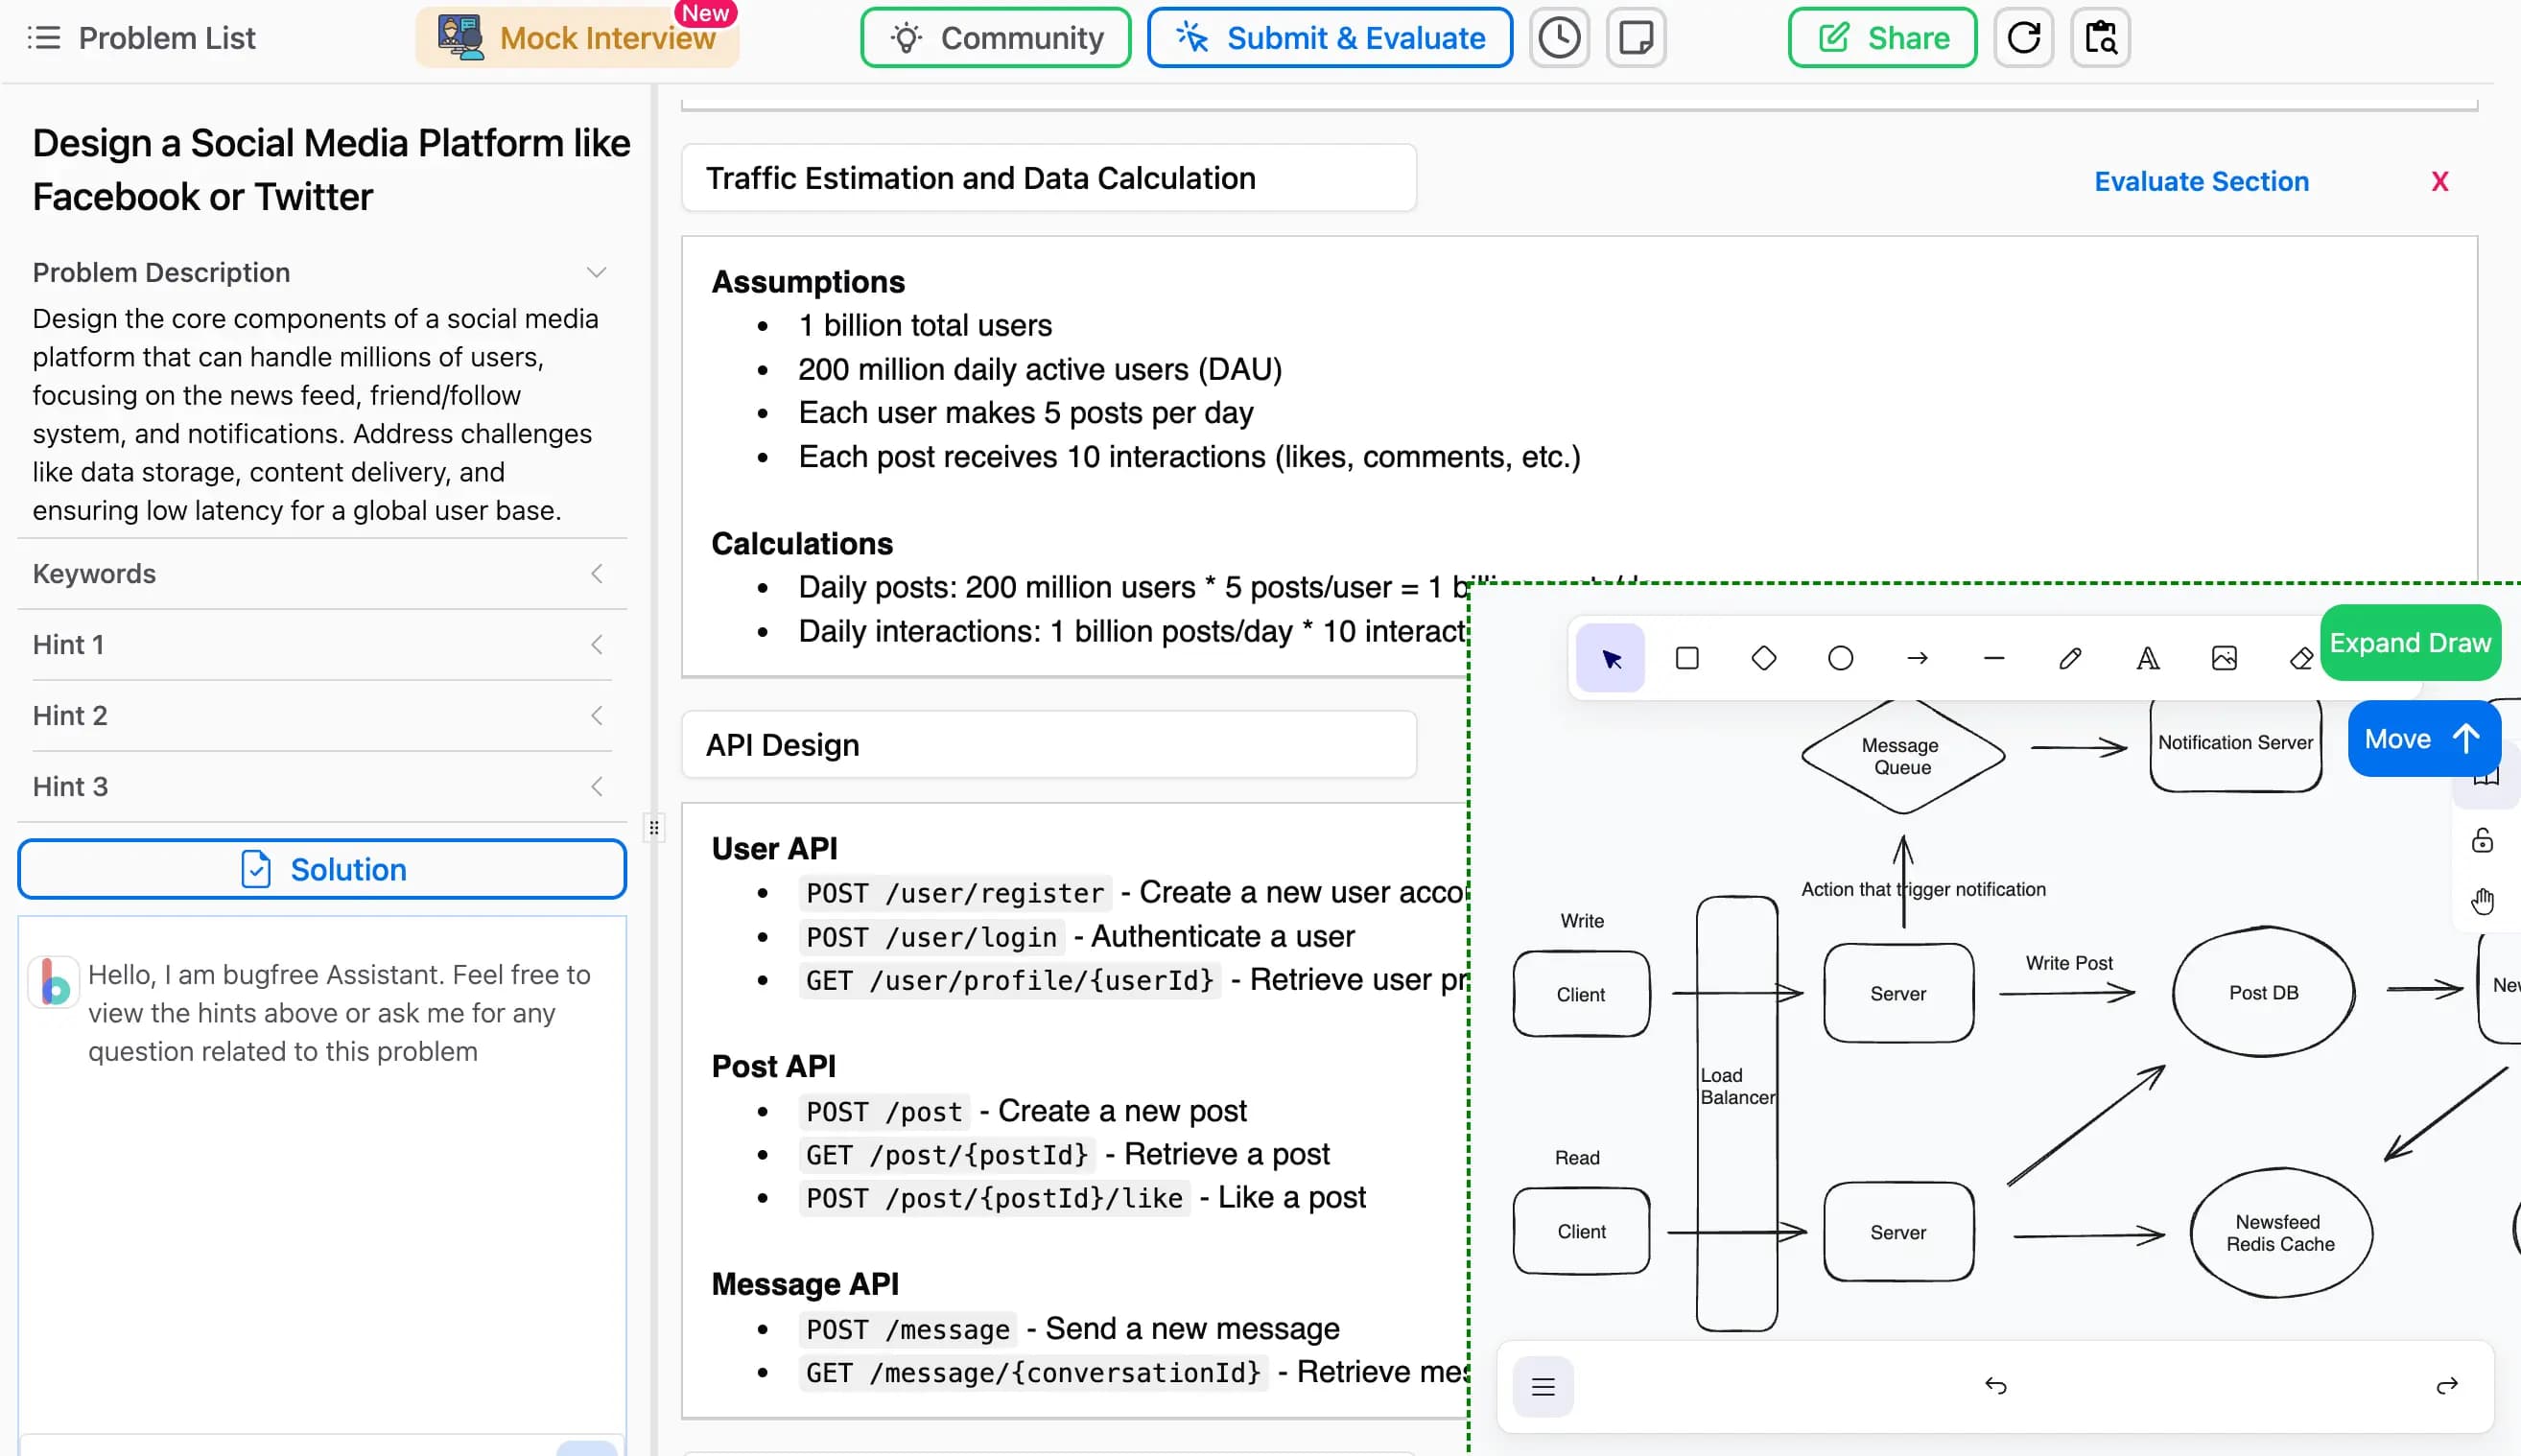
Describe tracking a user event end-to-end from frontend to BI tool
WHAT IT TESTS: Grasp of data pipeline layers from product to warehouse. ANSWER OUTLINE: Mention frontend instrumentation, routing, ingestion, warehouse transforms, and BI querying. RED FLAG: Stopping at the backend or confusing analytics with application logs.

Design an experiment and logging to link API latency to engagement
Causal inference and data integration. Randomly inject latency for a treatment group with a control at baseline, then join server trace IDs to client events via a shared request ID. Never confuse correlation with causation or miss join issues.
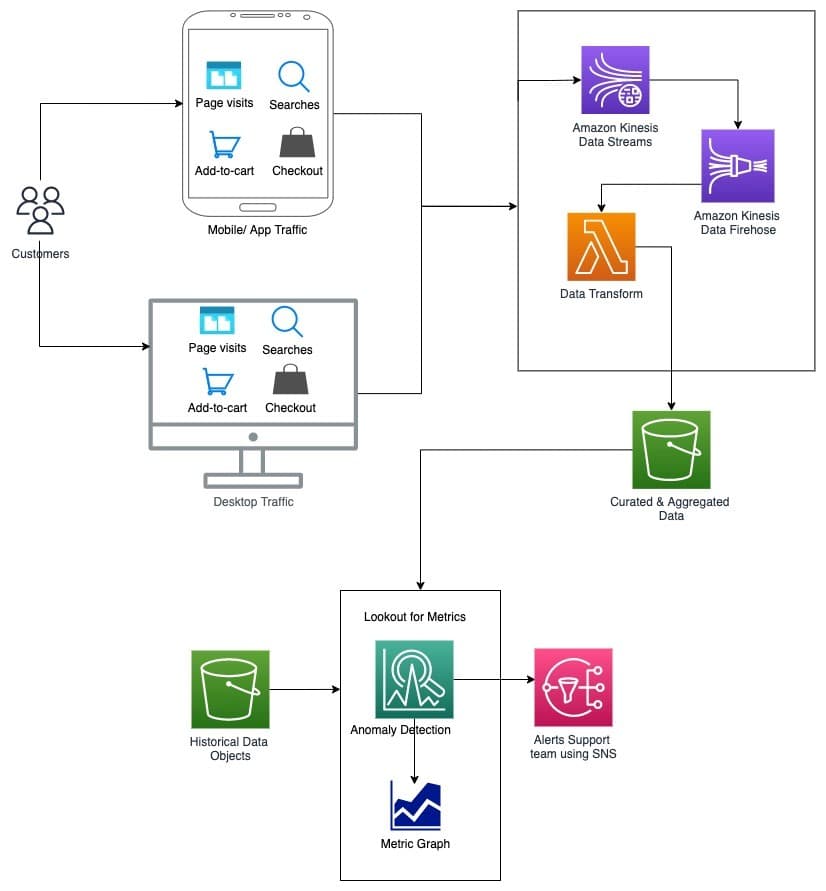
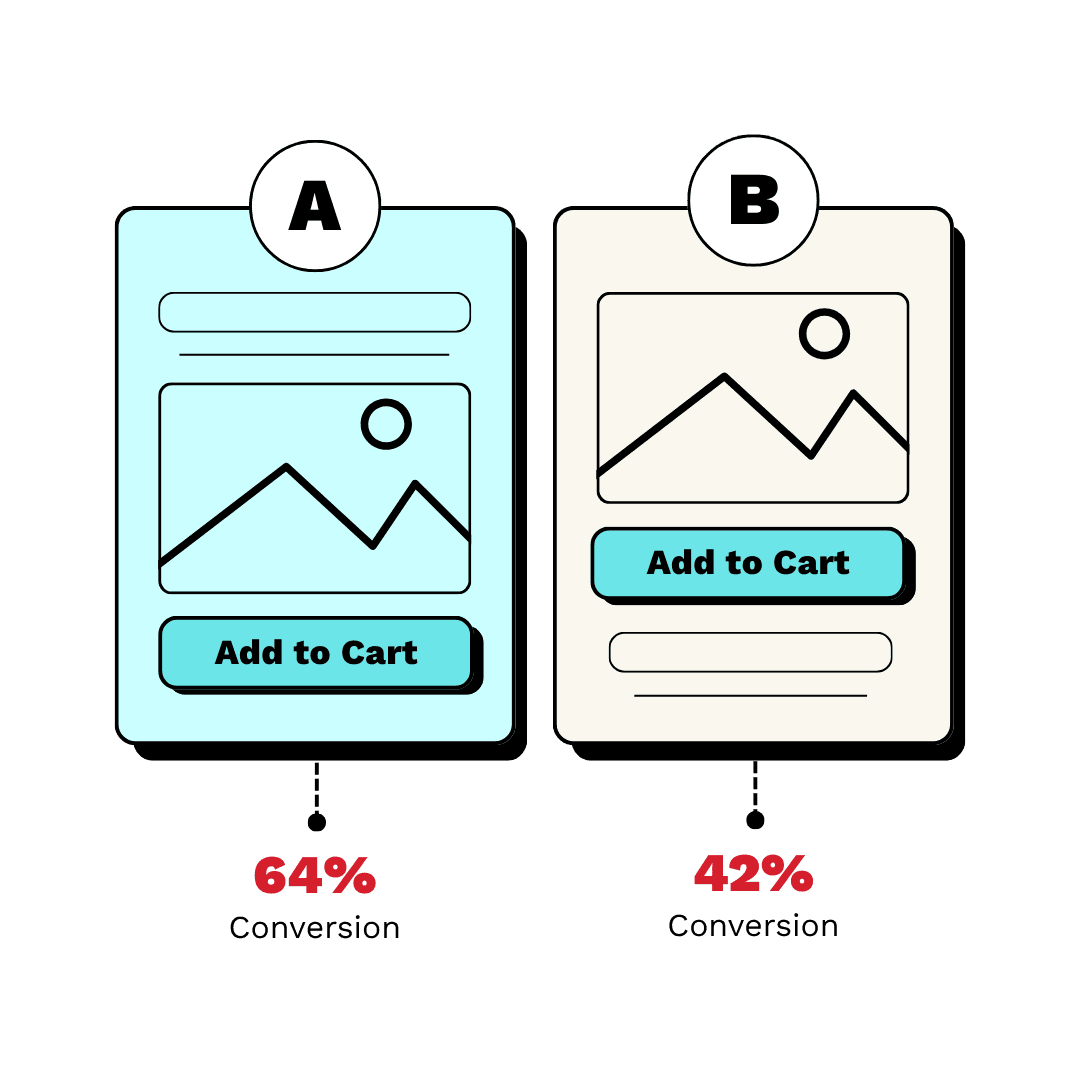
Design a system to detect sudden add-to-cart drops in real time
This tests streaming pipeline design and seasonality-aware anomaly detection. Outline Kafka or Kinesis ingestion, windowed aggregations, and ML baselines tuned to hourly and weekly trends. Red flag: static thresholds that ignore daily patterns.

Describe two methods for generating prediction intervals or probabilistic forecasts
Tests uncertainty quantification for risk-adjusted decisions. Strong answers: (1) parametric intervals via forecast error variance and normal multipliers, (2) bootstrap residual resampling for empirical percentiles.

Random split vs walk-forward validation in forecasting
WHAT IT TESTS: Awareness of temporal leakage. ANSWER OUTLINE: Random splits leak future data into training; walk-forward validation rolls the origin ahead, testing only on later observations. RED FLAG: Claiming random splits work for time-series.
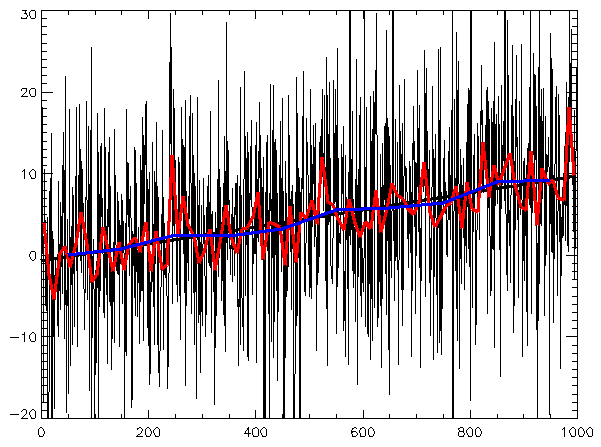
Describe key components for EDA on three years of daily user sign-ups
This tests time-series decomposition intuition. A strong answer covers trend, seasonality, and noise via plots, autocorrelation, and calendar effects, plus checks for missing days and outliers. Red flag: jumping to forecast models before validating structure.

Explain how CUPED increases statistical power and required data
Tests ANCOVA variance reduction. Answer: CUPED regresses pre-experiment X on Y, shrinking variance by (1-ρ²); needs pre-randomization prognostic baseline; beats difference scores. Red flag: calling it Y-X subtraction or saying it changes the effect.
What is the difference between a primary metric and a guardrail metric?
Tests whether you distinguish success criteria from safety checks in experiments. A strong answer defines primary metrics as the target outcome, guardrails as protective thresholds, and gives a concrete scenario where a primary lift does not justify shipping…
Why is stopping an A/B test at first significance problematic?
Tests peeking and Type I error inflation. Name peeking; explain daily looks inflate false positive rates above nominal alpha; note p-values assume one look at fixed sample size; recommend pre-committed runtimes or sequential testing.
How do you determine sample size and duration for an A/B test?
This tests statistical power literacy. A strong answer names baseline rate, MDE, alpha, and beta; explains the duration versus sensitivity trade-off; and notes traffic allocation. A red flag is ignoring power or stopping early when results look significant.

Explain Simpson's Paradox and construct a user engagement scenario
Tests whether you spot trends reversing when population mixes differ. Good answers define the paradox, give a numerical example with per-segment wins but aggregate loss, and warn against segment-only decisions.
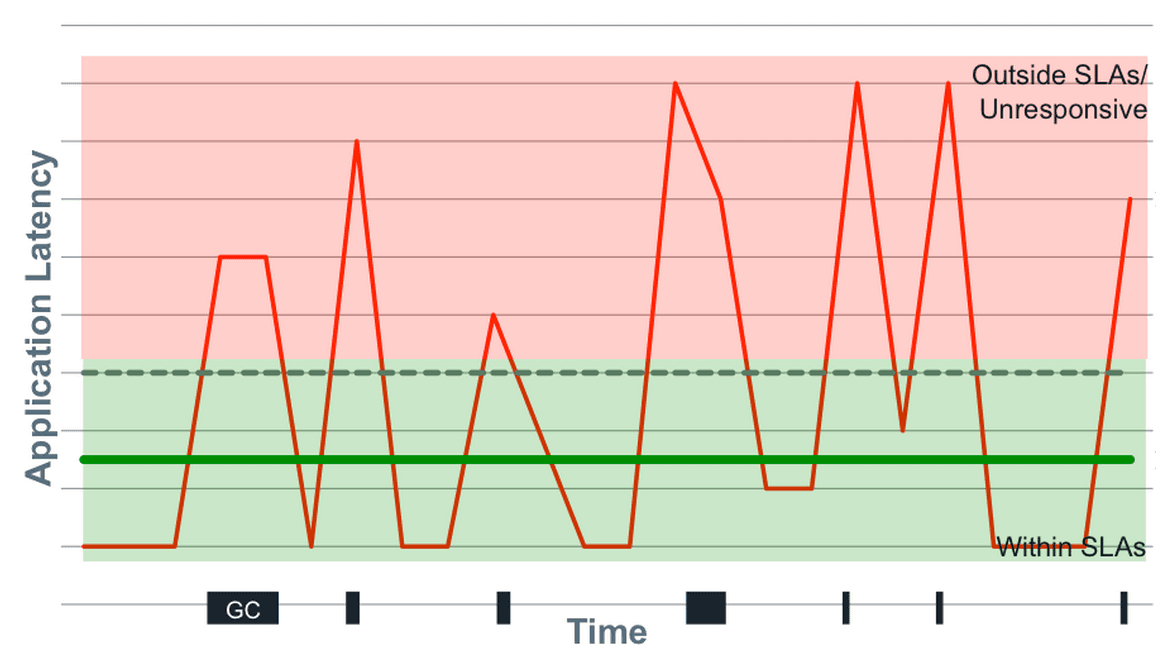
Mean or median for API response times?
Tests if you know latency is skewed and outlier-sensitive. Pick median over mean because hiccups distort the mean, but note median hides tail latency. Advocate for p95, p99, and max. Red flag: defending mean as representative or ignoring tail behavior.

Describe data architecture for fast multi-dimensional slicing and pre-computation trade-offs
Tests analytical architecture trade-offs between latency and cost. Strong answers propose a hybrid pipeline: columnar warehouse for flexible exploration plus pre-aggregated OLAP cubes for sub-second dashboards.
A/B test shows 5% lift with imbalanced mobile traffic. What next?
This tests sample ratio mismatch and Simpson's paradox. A strong answer says the lift is confounded by platform, demands stratified analysis to isolate the true effect, and checks randomization. A red flag is accepting the 5% lift without questioning skew.

Write SQL to generate a monthly cohort retention table from raw events
Tests window functions and date truncation for cohort analysis. A strong answer finds each user's first month, counts returning users per period, and divides by cohort size. Aggregating all users without isolating acquisition month hides new-user churn.

Average latency up 50ms but p99 flat: diagnose the discrepancy
Tests if you know mean reflects full distribution while p99 is a threshold. Strong answers hypothesize body shift like cache misses or traffic mix changes, and demand histograms and segmentation by endpoint. Red flag: blaming outliers, which would raise p99.
What user segments do you check first after a 10% DAU drop?
WHAT IT TESTS: Structured triage of a metric drop through user segmentation. ANSWER OUTLINE: Validate by time, platform, and geography; then slice by new vs returning, channel, and feature usage to isolate the bleeding cohort.

How would you visually represent statistical uncertainty in a chart?
Awareness that plotted points are perceived as exact truths. Replace isolated bars with intervals showing point estimate uncertainty; add hypothetical outcome plots to make values tangible. Offering p-values or raw means without visualizing uncertainty range.

Explain pre-attentive attributes and give three examples
This tests whether you know preattentive attributes are decoded in <200ms to guide attention freely. Name three such as color hue, size, and motion; then encode one variable in a dense scatter plot so targets pop out. Never call this decoration or color all.

How would you structure a user engagement dashboard for PMs?
Tests narrative sequencing of metrics across abstraction layers. Strong answer: DAU headline for health, retention cohorts for pattern diagnosis, feature adoption funnels for root-cause drill-down.