Describe key components for EDA on three years of daily user sign-ups
This tests time-series decomposition intuition. A strong answer covers trend, seasonality, and noise via plots, autocorrelation, and calendar effects, plus checks for missing days and outliers. Red flag: jumping to forecast models before validating structure.
WHAT THIS TESTS: This question checks whether you treat a time series as ordered, equally spaced discrete-time data rather than a static cross-sectional sample. The interviewer wants to see that you validate temporal structure before making assumptions about independence or distribution. Mentioning that daily observations are discrete-time points indexed in chronological order shows you understand the basic definition.
A GOOD ANSWER COVERS: A strong response moves through four areas in order. First, data integrity and spacing: verify there are no missing days, duplicate timestamps, or timezone shifts because the sequence must be equally spaced to form a valid discrete-time series. Second, visual inspection of the raw series: plot the three years of daily sign-ups to spot obvious trend direction, level shifts, or anomalous spikes. Third, decomposition into components: separate the signal into long-term trend, repeating seasonal patterns such as day-of-week or month-of-year effects, and residual noise. Fourth, autocorrelation and lag analysis: check whether today's sign-ups correlate with yesterday's or last week's to reveal cyclic behavior that violates independence assumptions.
COMMON WRONG ANSWERS: The biggest red flag is jumping straight to model names like ARIMA or Prophet without first describing what you would look for in the data. Another mistake is treating the data as independent draws and reporting simple means or histograms while ignoring chronological order. Failing to mention calendar effects or holiday anomalies is also a weakness for daily data. A third error is neglecting to check for data collection gaps around weekends or holidays.
LIKELY FOLLOW-UPS: The interviewer may ask how you would handle a sudden drop on a specific date, whether you would transform the series for stationarity, or how you would distinguish between a one-time campaign spike and a lasting trend shift. They might also ask you to sketch what the decomposition plot would look like for a consumer product with strong weekly seasonality. Be ready to explain why you would difference the series or take a log transform.
ONE CONCRETE EXAMPLE: Suppose sign-ups rise every Monday and fall every Saturday, grow twenty percent year over year, and spike on Black Friday. In your EDA you would flag the weekly seasonality with a seven-day autocorrelation, quantify the yearly trend with a rolling thirty-day average, and isolate the Black Friday residual as an outlier to avoid distorting baseline forecasts. You would also verify that the Black Friday spike does not create a phantom trend line.
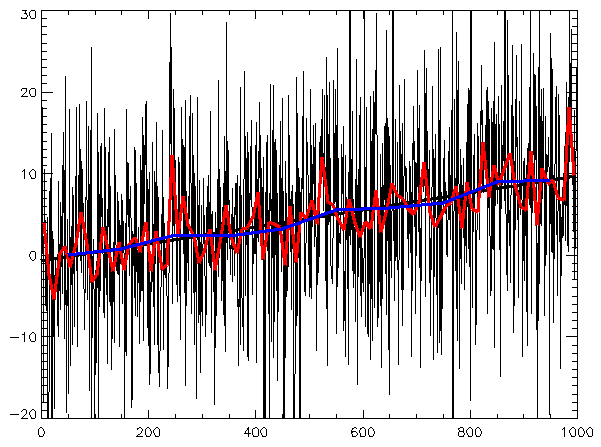
Source: Wikipedia: Time series
Read the original → Wikipedia: Time series
- #time series
- #eda
- #analytics
- #data quality
- #seasonality
Get five bites like this every day.
Tezvyn delivers a daily feed of 60-second tech bites with quizzes to lock in what you learn.