Design a follow-up experiment to resolve conflicting qualitative and quantitative data
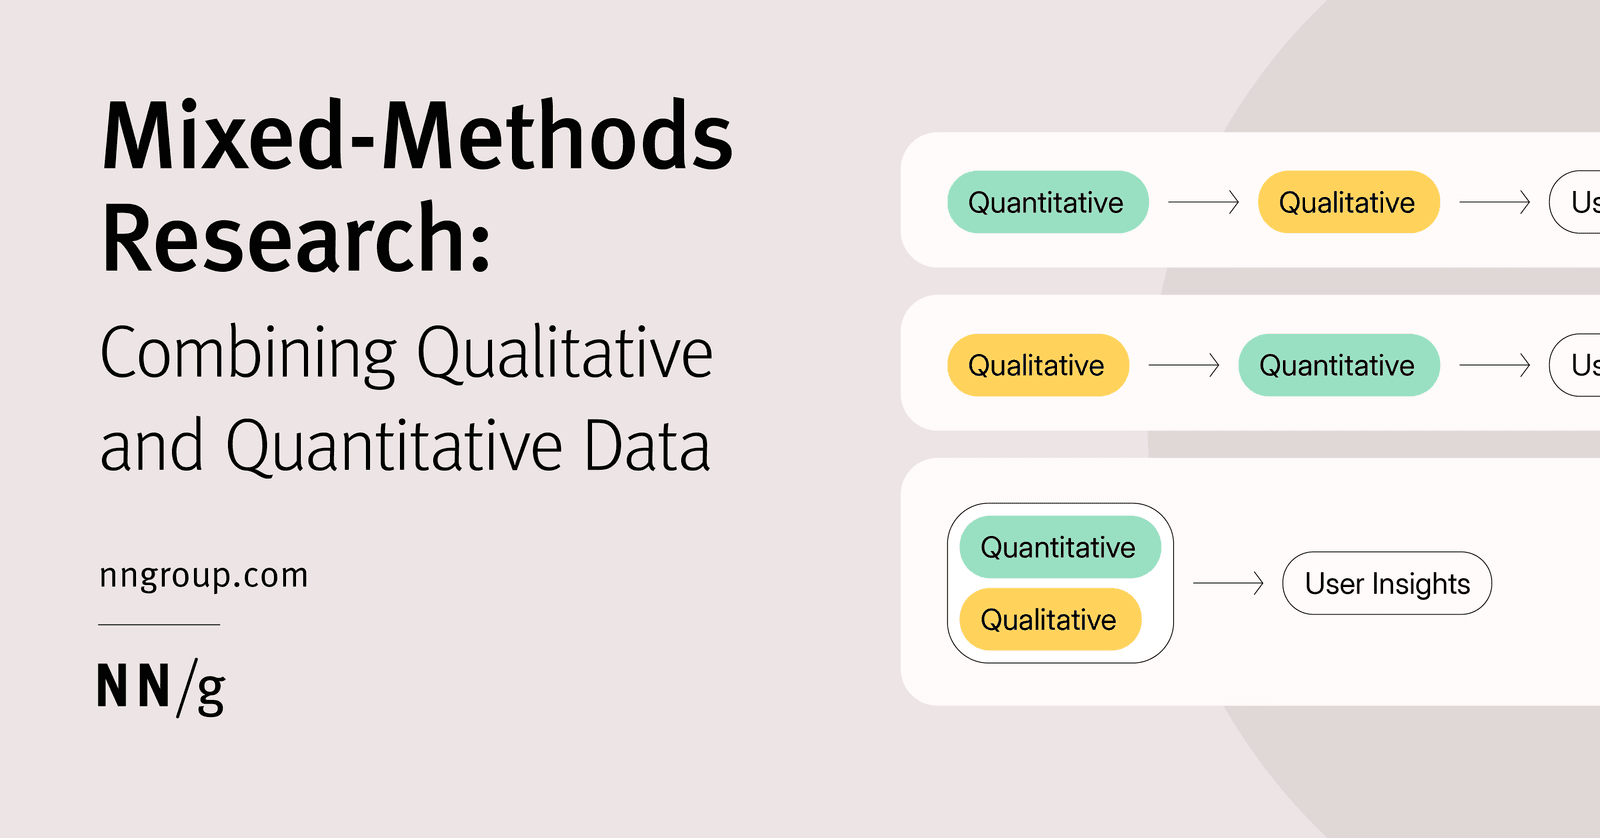
This tests mixed-methods integration. Strong answers sequence experiments: observe users in the low-engagement flow for friction, then run a higher-fidelity quantitative test with behavioral metrics tied to stated intent.
What's really being asked
Your ability to intentionally integrate qualitative and quantitative methods under a single research question rather than treating them as separate votes. The interviewer wants to see if you can diagnose why stated intent and measured behavior diverge, design a sequenced experiment that uses each method for its strengths, and define a clear decision framework. Senior candidates should surface hidden variables like prototype fidelity, task realism, metric selection, and sampling bias.
The full answer
Four things in order. First, hypothesis generation for the conflict. You should name at least three distinct failure modes: the say-do gap where social desirability skewed interviews, a prototype fidelity problem where the MVP was too rough to test the real value proposition, and a metric mismatch where engagement was measured too early or with the wrong behavioral proxy. Second, a qualitative follow-up specifically anchored to the quantitative failure. This means running a moderated usability study using the exact A/B prototype and task flow, asking participants to think aloud so you can observe friction points that the aggregate data hid. Third, a redesigned quantitative experiment with higher fidelity and better instrumentation. This includes switching from a shallow engagement metric like click-through rate to a behavioral proxy for intent such as seven-day return rate or depth of exploration, running a power analysis to ensure adequate sample size, and defining a minimum detectable effect before launch. Fourth, an explicit decision gate that weights both streams against a single user need statement, for example a rubric that requires both qualitative severity scores and quantitative statistical significance to greenlight the feature.
The mistakes people make
Rerunning the same A/B test with more traffic and hoping significance changes. Dismissing the interviews as purely anecdotal or claiming the quantitative data is objective truth without context. Proposing to average or merge the two datasets without a unified research question. Suggesting a survey as the tiebreaker because surveys sit in a methodological no-mans land that explains neither behavior nor motivation deeply. Designing the follow-up as two parallel tracks that never intersect, which misses the core point of mixed-methods integration.
What usually comes next
How would you choose the specific behavioral proxy if the feature has no direct conversion event? What would you do if the qualitative study shows users love the concept but the prototype crashes on mobile? How do you prevent your own bias from shaping the usability tasks after seeing the A/B results? At what sample size would you trust the qualitative findings enough to override the quantitative test?
A concrete example
A team building a hotel website sees interviewees say they want flexible cancellation, but an A/B test of a prototype cancellation widget shows a 0.8 percent engagement rate. Instead of killing the feature, you recruit 8 to 12 participants for a moderated think-aloud session using the exact prototype. You discover that users cannot find the widget because it is buried below the fold under a generic Settings label. You revise the prototype to surface the policy at the room-card level, then run a higher-fidelity A/B test measuring not just clicks but return visits within seven days. You set a decision gate requiring both a statistically significant lift in return rate and a qualitative severity score below two out of five for findability issues.
Interview question
Which sequencing strategy best resolves a conflict between qualitative intent data and low-engagement quantitative A/B results?
- a.Generate hypotheses for the conflict, run a targeted qualitative study on the A/B flow, then redesign the quantitative experiment with better behavioral proxies and a decision gateCorrect
- b.Merge the interview transcripts and click-through rates into a single weighted score to identify the true user preference
- c.Run the qualitative and quantitative investigations in parallel without a shared research question, reconciling findings only in the final report
- d.Increase A/B traffic and run a survey as a tiebreaker to resolve the discrepancy
Why? this is the answer
This approach correctly sequences hypothesis generation, targeted qualitative friction-finding on the exact A/B flow, and a redesigned higher-fidelity quantitative experiment with a unified decision gate. Option D is tempting because increasing sample size feels rigorous, but rerunning the same test and using a survey fails to diagnose the root cause of the say-do gap and relies on a method that explains neither behavior nor motivation deeply.
Just read this? Test yourself on what you have been reading.
Read the original → nngroup.com
- #mixed-methods
- #product-strategy
- #experiment-design
- #user-research
- #ab-testing
You just looked this up. Could you explain it out loud?
That is the part interviews actually test. Tezvyn takes questions like this one and gives you what the interviewer is really checking, the answer that lands, and the mistake that ends the conversation, in the four minutes before your next meeting.
The iPhone app is on the way
We are building it. Until it lands, nothing here is held back from you: every interview card, your saved cards, streaks and the job board all work in Safari, plus hundreds of free practice quizzes of thirty questions each. Sign in and it all carries over to the app the day it arrives.
Want it as an icon? Tap Share at the bottom of Safari, then Add to Home Screen. It opens full screen and the cards you have read stay available offline.
We are hiring for this. Every open role lists the topics its interview covers, so you can prepare for the real thing rather than guessing.
See open roles