Funnel Analysis: Pinpointing Where Users Drop Off
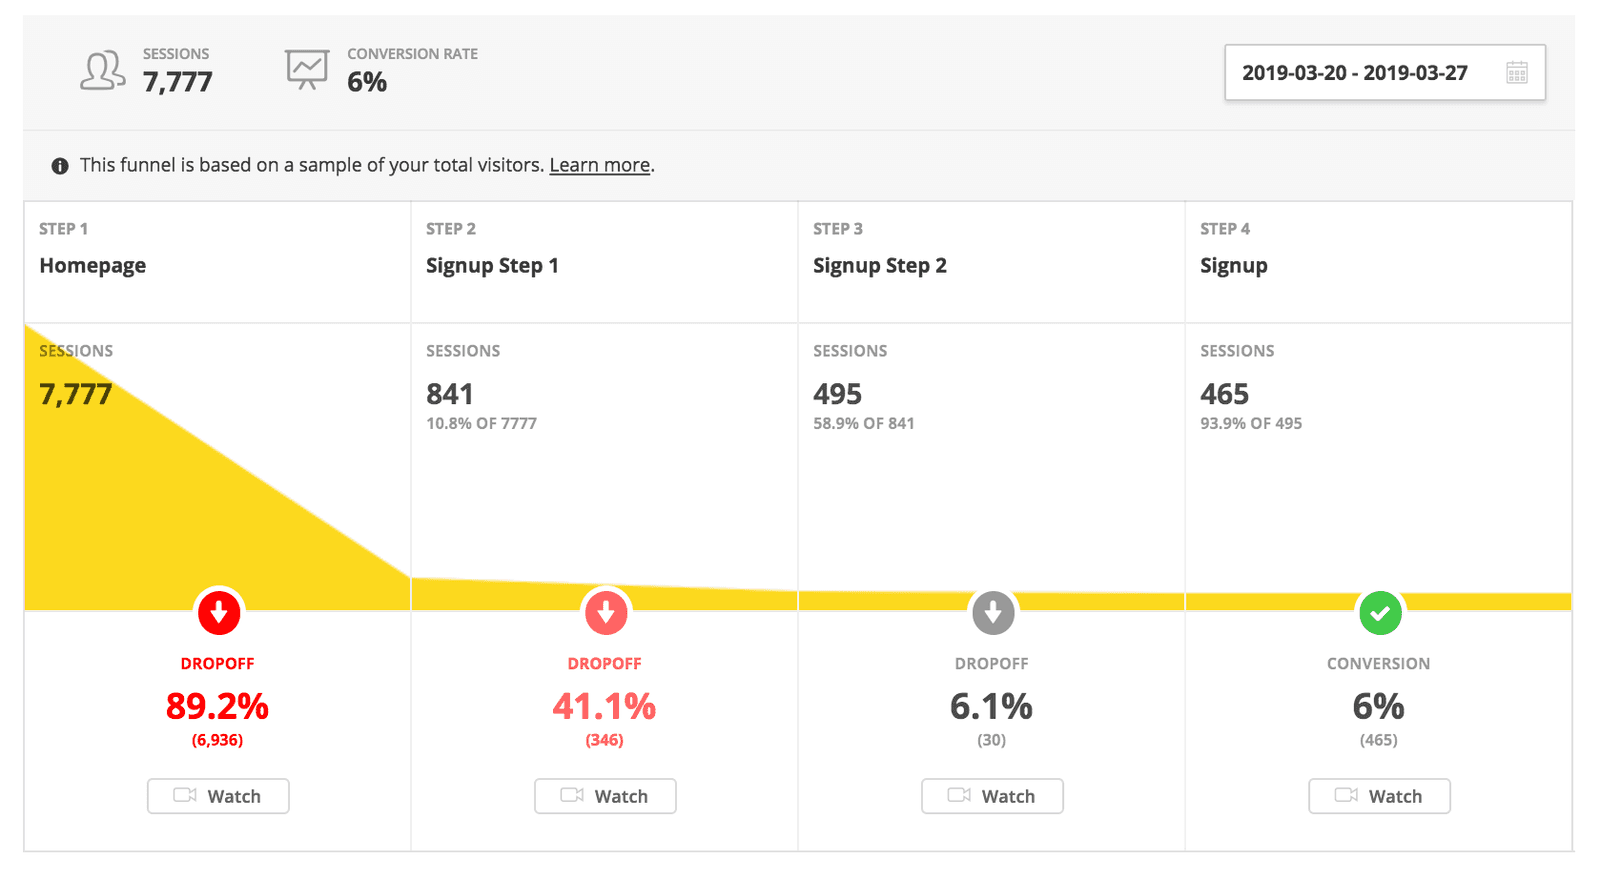
Funnel analysis treats a user journey like a real-world funnel, showing exactly where people 'leak' out before reaching a goal. It's key for optimizing e-commerce checkouts or app sign-ups. The footgun is only looking at the final conversion rate.
THE MENTAL MODEL: Imagine pouring users into the top of a funnel. Not all of them will make it out the bottom. Funnel analysis is the practice of measuring a multi-step process to see how many users complete each step and, more importantly, where they drop off. It shifts the focus from a single, final conversion rate to the conversion rates between each intermediate step, answering the question: "Where are we losing people?"
HOW IT WORKS: You first define a sequence of key events that lead to a goal. For a purchase, this might be: 1. Viewed Product, 2. Added to Cart, 3. Started Checkout, 4. Completed Purchase. You then measure how many unique users complete each event in that specific order. The analysis reveals the conversion rate from one step to the next, like the percentage of users who added an item to their cart and then started checkout. This highlights the leakiest parts of your user journey.
WHEN TO USE IT: Funnel analysis is ideal for any linear, goal-oriented process where users are expected to follow a specific path. Three common use cases are: first, optimizing e-commerce checkout flows to reduce cart abandonment; second, improving user onboarding to increase activation rates; and third, tracking marketing campaign performance from ad click to lead submission.
WHEN NOT TO USE IT: This model is less effective for non-linear user journeys where users can complete steps in different orders or jump around. If your product encourages exploration rather than a single path to a goal, a funnel is the wrong tool. It can oversimplify complex behavior and miss valid alternative paths users take to achieve their goals.
ONE CANONICAL EXAMPLE: An e-commerce site tracks its purchase funnel. 10,000 users view a product page. Of those, 1,000 add it to their cart (10% conversion). Of those, 500 start the checkout (50% conversion). Finally, 400 complete the purchase (80% conversion). The overall conversion is 4%. While the checkout-to-purchase step is strong (80%), the biggest drop-off is the 90% of users who viewed the product but never added it to their cart. This tells the team to investigate the product page, not the payment form.
Read the original → en.wikipedia.org
Get five bites like this every day.
Tezvyn delivers a daily feed of 60-second tech bites with quizzes to lock in what you learn.