
How do you determine required sample size for an A/B test?
Tests statistical power and experimental design. Name four inputs: baseline conversion rate, minimum detectable effect, alpha (5%), and power (80%), then solve for N. Red flag: "test until significant" or fixed guesses like 1000 users without effect size.

High ROC-AUC but low PR-AUC: what does this imply?
Tests if ROC-AUC hides imbalance while PR-AUC exposes it. Severe imbalance dilutes FPR across many negatives, inflating ROC-AUC, but precision crashes. Critical for rare positives with costly false positives. Praising the model on ROC-AUC alone fails.

What is cross-validation and why is it more robust than a holdout split?
WHAT IT TESTS: Understanding of generalization and evaluation variance. ANSWER OUTLINE: A single split is noisy and wastes data; k-fold rotates each fold as test, averages scores, and trains on all data.

How would feature engineering for categoricals differ for logistic regression versus LightGBM?
It tests model-specific encoding decisions. Logistic regression needs one-hot to avoid false ordinality; tree models like LightGBM use ordinal encoding since splits rely on thresholds, not distance.

Explain bias-variance tradeoff and how regularization or tree depth manage it
Tests understanding of generalization error decomposition. Define bias as underfitting and variance as sensitivity to training noise; show regularization and shallow trees trade excess variance for slightly higher bias. Red flag: claiming both can hit zero.
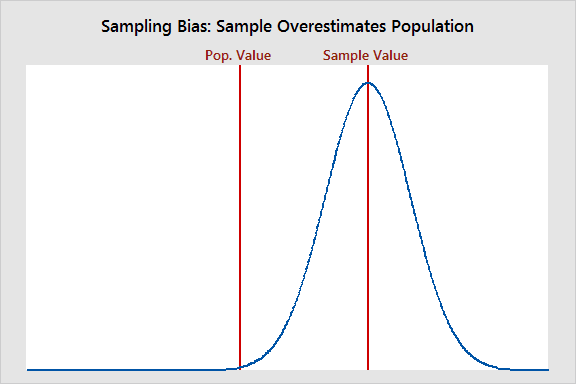
How can EDA and visualization identify dataset bias before modeling?
Tests operationalizing bias detection before modeling. Strong answers compare sample distributions to population norms, audit feature coverage with heatmaps, and track missingness by subgroup. Red flag: citing only class imbalance or ignoring sampling frame.

Describe your systematic approach to interpreting an 8-feature pair plot
WHAT IT TESTS: multivariate EDA beyond linear correlation. ANSWER OUTLINE: check 8 diagonals for skew; scan 28 off-diagonals for nonlinear trends, variance patterns, and hue clusters; flag redundancy; spot outliers.

How would you visualize high-cardinality categorical relationships?
This tests dimensionality reduction when categories exceed roughly fifty levels. A strong answer proposes top-N aggregation with an other bucket and density or hierarchy plots like heatmaps or treemaps. A red flag is scrolling a bar chart or sampling rows.

How do you visualize clusters in 100-dimensional numerical data?
Tests PCA versus t-SNE tradeoffs for high-dimensional visualization. Strong answers use PCA first for global variance and outliers, then t-SNE with perplexities 5-50 run to stability. Red flag: interpreting t-SNE cluster sizes or distances as literal metrics.
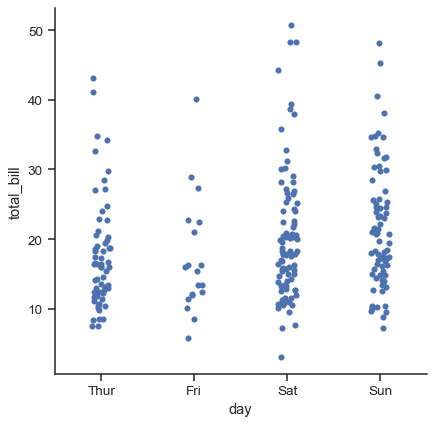
Which plot visualizes a continuous versus categorical variable and why?
This tests categorical plot selection for continuous vs categorical relationships. A strong answer names boxplots or violinplots for distribution shape and outliers, or swarmplots for density, and cites median spread, skew, and anomalies.
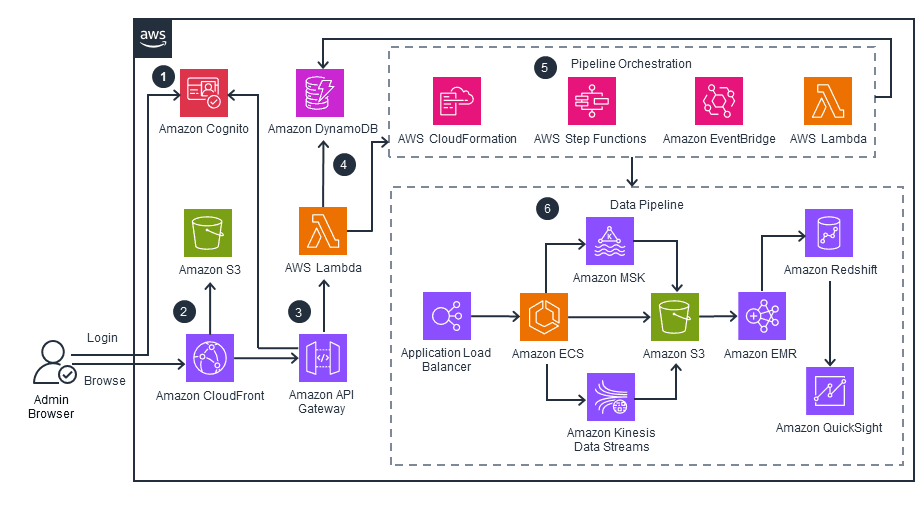
Design a clickstream pipeline from ingestion to data warehouse
Tests data pipeline design under load: buffering, idempotent transform, and warehouse modeling. A strong answer orders ingestion via Kinesis or MSK, Spark EMR sessionization, and Redshift star schemas. Red flag: no buffer and direct warehouse writes.

How would you monitor data quality for a C-level dashboard pipeline?
WHAT IT TESTS: Designing production data observability for executive dashboards. A strong answer maps freshness SLAs, completeness checks, and distribution drift detection to business impact.
What is data pipeline idempotency and how do you design for it?
This tests resilient pipeline design under failure. A strong answer defines idempotency as identical output on repeated runs, highlights safe retries and partial failure recovery, and proposes idempotency keys with atomic writes for daily API loads.
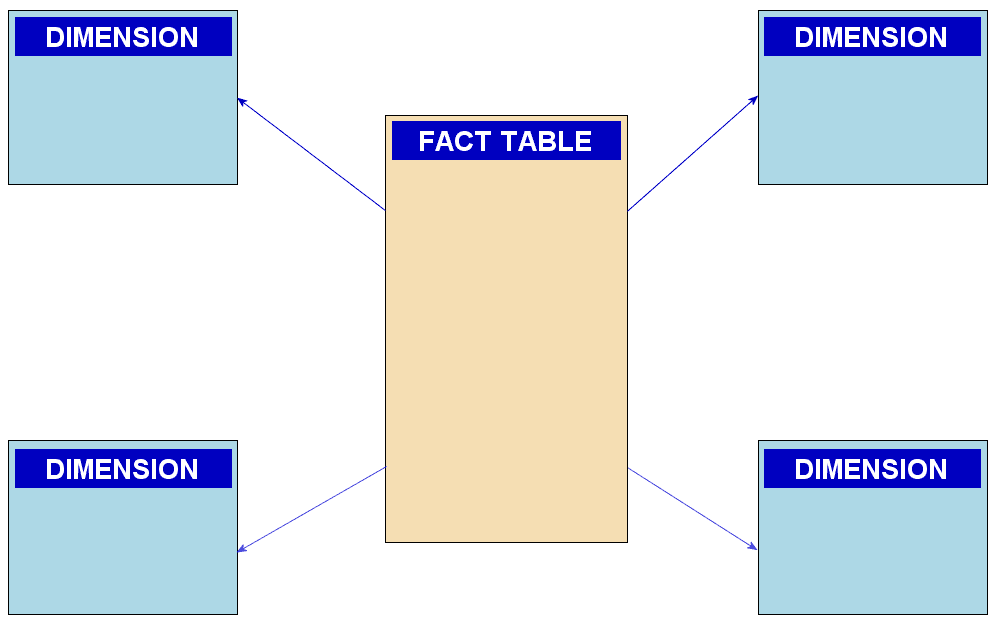
Star schema vs snowflake schema: differences and trade-offs
Tests dimensional modeling: star schemas flatten dimensions for fast joins and simple queries, while snowflakes normalize them to cut redundancy at the cost of extra joins. Red flag: praising snowflake storage savings without admitting query overhead.

Describe the difference between ETL and ELT and when to choose each
Tests transform timing and compute location. ETL cleans data before loading via external engines; ELT loads raw data first, then transforms in the warehouse. Pick ETL when pre-load cleansing is needed, ELT when warehouse compute is cheaper.
How do you prevent future leakage in time-series preprocessing?
This tests temporal causality in feature engineering and validation. Use only past data for lags and rolling windows and enforce a rolling validation split without shuffling. Red flags are random k-fold CV and global standardization leaking future information.

Why avoid one-hot encoding for high cardinality and what are alternatives?
This tests dimensionality explosion and encoding alternatives. A strong answer notes one-hot creates hundreds of sparse binary columns, causing memory bloat and overfitting, then names two strategies like target encoding and count encoding.
Min-Max scaling vs Z-score standardization: differences and algorithm preferences
Tests if you know how feature scaling works and can pair a scaler with algorithmic assumptions. Contrast [0,1] Min-Max against mean-zero Z-score, then defend standardization for PCA or gradient descent.

Design a scalable, fault-tolerant real-time IoT data ingestion system
This tests separation of edge connectivity, buffering, and processing. A strong answer names an edge gateway, Kafka as the backplane, stream processing, and cold storage, plus backpressure and partitioning.

Design an incremental load pipeline from a transactional DB to a warehouse
WHAT IT TESTS: OLTP-to-OLAP sync without full dumps. ANSWER OUTLINE: Contrast timestamp watermarking, CDC from transaction logs, and open-table incremental reads; cite merge logic and idempotency.