
Implement OAuth 2.0 flow to get an access token for API requests
Tests your grasp of OAuth 2.0 grant-type selection and token lifecycle. Strong answers match the script context to client credentials or authorization code flow, detail the token endpoint exchange, and address refresh and expiry.
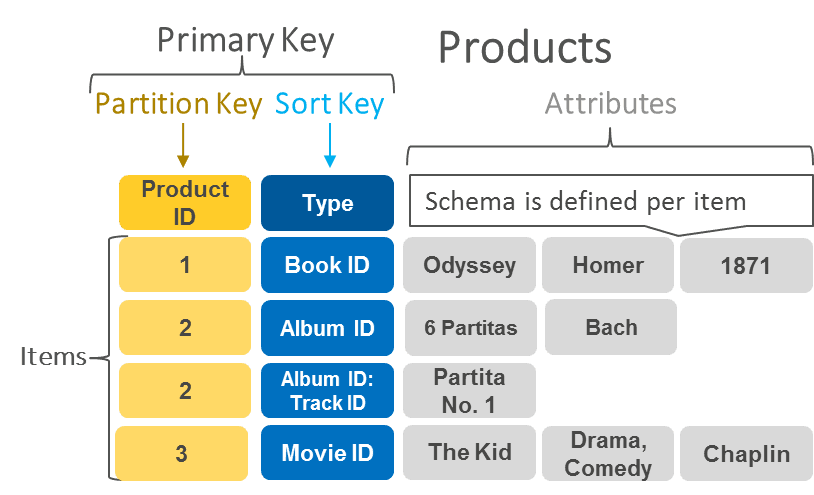
SQL or NoSQL for high-volume semi-structured event ingestion?
WHAT IT TESTS: schema flexibility and write throughput for raw event ingestion. ANSWER OUTLINE: Choose NoSQL for schema-less landing; use SQL downstream for structured analytics. RED FLAG: Picking SQL for raw clicks because ACID is needed.

Design a rate-limited REST API data collection script
Tests client-side throttling discipline versus reactive 429 handling. Strong answers proactively pace calls using rate-limit headers, cap concurrency, and apply exponential backoff with jitter. Red flag: tight-loop retries or ignoring headers.

What is robots.txt, why respect it, and consequences of ignoring it?
WHAT IT TESTS: Your grasp of ethical and legal guardrails in data collection. ANSWER OUTLINE: It disallows crawler paths via the Robots Exclusion Protocol; honoring it prevents server strain, legal risk, and broken trust. RED FLAG: Calling it optional.

How do you fetch JSON from a REST API and parse it?
This tests practical fluency with HTTP mechanics and JSON deserialization. A strong answer names the method, URL, and headers; checks the status code; then parses with r.json() or json.loads. A red flag is skipping error handling or confusing GET with POST.

Process a 50GB CSV with only 16GB RAM
WHAT IT TESTS: Streaming aggregation under memory constraints. ANSWER OUTLINE: Chunk with read_csv chunksize, filter columns via usecols, downcast int64 to int32/int16, skip rows. RED FLAG: Loading everything into one DataFrame or using default dtypes.
Calculate total and average sales per region in pandas
Tests split-apply-combine fluency. A strong answer groups by Region then calls agg with a dict or named aggregation to return sum and mean of Sales_Amount together. Red flag: chaining separate groupby calls or looping rows manually.

How would you combine customer and transaction DataFrames and describe join types?
This tests relational merging and join semantics in pandas. Answer: use pd.merge on customer_id, then groupby sum; describe inner, left, right, and outer joins by key preservation. Red flag: proposing concat without keys or conflating inner and left joins.

Describe strategies for handling missing values in pandas DataFrames
Tests practical judgment on cleaning trade-offs. Good answers contrast dropna when data is abundant against fillna imputation to preserve rows, noting bias risk. Red flag: prescribing one fix without asking why values are missing or what the model needs.

Why is 99% accuracy misleading with 1% disease prevalence?
Tests class imbalance intuition. A strong answer notes that an all-negative classifier hits 99% accuracy, then names precision, recall, F1, and AUC-PR to expose false negatives and false positives. Red flag: claiming accuracy is fine after rebalancing.

Describe the bias-variance tradeoff and how model complexity affects bias and variance
WHAT IT TESTS: Your grasp of error decomposition into bias squared, variance, and noise. ANSWER OUTLINE: More complexity cuts bias but boosts variance via overfitting; test error forms a U. RED FLAG: Claiming both bias and variance fall as parameters grow.

Explain the Central Limit Theorem and its importance for hypothesis testing
This tests whether you know why sample means from skewed populations tend toward normal as size grows, enabling tests. A strong answer covers mean convergence to normal and standard error. Red flag: claiming the CLT works for small samples or single points.
What are your null and alternative hypotheses for this A/B test?
This tests translating a directional business question into statistical hypotheses. A strong answer states H0 as no difference in registration rate and H1 as green outperforming blue. A red flag is framing H0 as "blue is better" or using a two-tailed test.

How would you build and validate a proxy target for employee burnout?
WHAT IT TESTS: operationalizing unobserved constructs into ML targets from messy HR data. ANSWER OUTLINE: combine survey scales with behavioral signals such as off-hours logins and PTO drops; validate via convergent and predictive validity against attrition.

How do you frame high-value customer identification as classification versus regression?
Tests mapping a business goal to a defensible target. Outline: define value and action, then contrast regression predicting spend versus classification predicting tiers. Red flag: picking models before fixing the label or the campaign action.

How would you validate that search users are more likely to purchase?
This tests correlation versus causation in product analytics. A strong answer defines the purchase window, matches searchers to similar non-searchers, and picks a statistical test. A red flag is running a t-test without controlling for user intent or time.

Walk me through Canny edge detection and why it beats Sobel thresholding
Tests multi-scale edge detection and noise robustness versus raw gradient thresholding. Strong answer lists Gaussian blur, Sobel gradients, non-maximum suppression, double thresholding, hysteresis. Red flag: calling it blurred Sobel without hysteresis or NMS.

How does filter separability optimize Gaussian blur and its complexity?
This tests if you know a 2D Gaussian separates into two 1D convolutions. A strong answer gives complexity as O(N^2 K^2) dropping to O(N^2 K) for an N-by-N image and K-by-K kernel. A red flag is claiming all kernels are separable or omitting dimensions.

Zero-padding vs reflect vs replicate padding and their visual artifacts
This tests boundary assumptions in convolution. Zero-padding adds black borders causing dark vignettes; reflect padding mirrors edges for continuity; replicate padding repeats edge values outward. A red flag is saying padding choice does not affect outputs.

How does the Sobel operator approximate image gradients for edge detection?
This tests discrete gradient approximation via separable convolution. A strong answer covers 3x3 Gx and Gy kernels as smoothed central differences, then combines magnitude as sqrt(Gx^2 + Gy^2) or L1 norm. A red flag is treating them as arbitrary blur filters.