A/B Test Results with Skewed Traffic: What's Next?
This tests your ability to spot confounding variables. A good answer invalidates the results due to sampling bias, proposes segmenting the data by device to find the true effect, and suggests re-running the test with correct randomization.

How to query a monthly cohort retention table in SQL?
Tests your ability to translate a core business metric into a multi-step SQL query. A good answer finds each user's acquisition month, joins that back to their activity, and pivots the data into a cohort grid. A red flag is calculating aggregate retention.

Average latency is up 50ms, but p99 is flat. How do you diagnose this?
Tests your grasp of latency metrics. A rising average with flat p99 means the *bulk* of requests (p50-p90) slowed, not the tail. Hypothesize a common bottleneck and segment data by endpoint/user to find it. Red flag: blaming new, slow outliers.
DAU dropped 10%. How do you investigate?
Tests structured problem diagnosis. First, verify the data isn't corrupt. Then, segment the drop by user type (new vs. returning), platform (iOS/Android/Web), and geography to isolate the 'what' before hypothesizing the 'why'.
How would you visually represent statistical uncertainty in a chart?
This tests your ability to accurately communicate statistical significance. A great answer discusses error bars (with 95% CIs), then more advanced options like gradient or violin plots, and frames the choice by audience.

How would you design a product management dashboard?
This tests your ability to structure data hierarchically for a specific persona (PM). A great answer outlines a 3-tier structure: summary KPIs, trend analysis, and drill-downs. A red flag is listing charts without explaining how they guide PM decisions.

When is a pie chart an appropriate visualization?
Tests your grasp of data viz principles for part-to-whole data. A good answer defines this use case (e.g., market share), then lists pitfalls like too many slices or comparing multiple pies. A red flag is defending pie charts for complex data.

How do you manage schema evolution in an analytics pipeline?
This tests your grasp of data as a contract. A great answer covers schema registries, backward compatibility, and a phased rollout from producer to warehouse. A red flag is only mentioning an `ALTER TABLE` command, ignoring the entire data pipeline.

Challenges of Grouping by High-Cardinality Dimensions
This tests your grasp of system-level impacts of data shape. A good answer explains how high cardinality strains memory during aggregation, reduces compression, and inflates index size, leading to slow, expensive queries. A red flag is just saying 'it's slow'.
Trade-offs: Pre-aggregation vs. Querying Raw Data
Tests your grasp of data system trade-offs. A great answer weighs pre-aggregation (fast, cheap, stale) against querying raw data (slow, costly, fresh, flexible) and proposes a hybrid solution. A red flag is declaring one method universally superior.
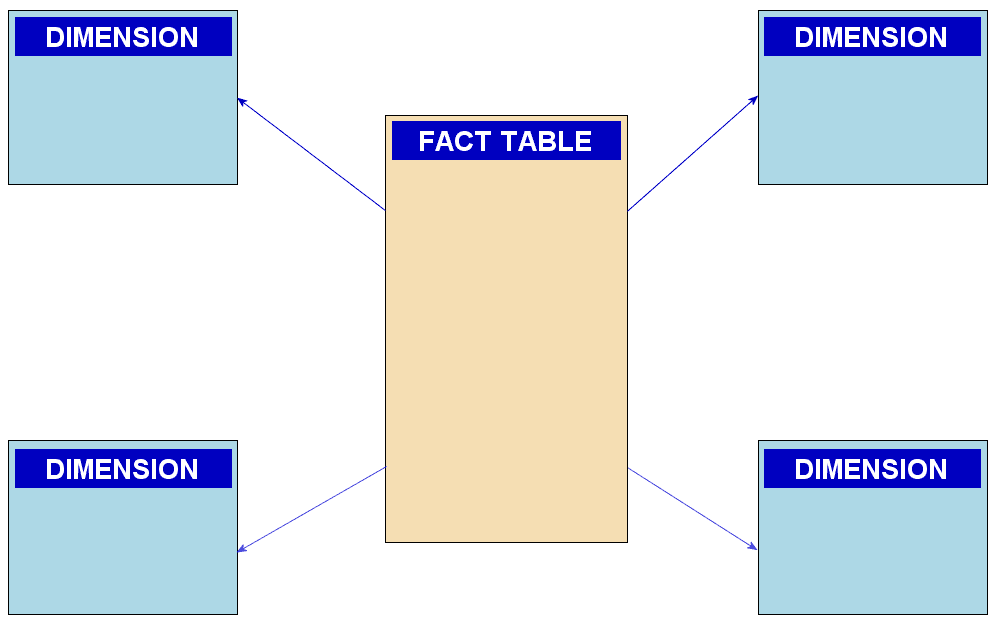
Explain the star schema and its advantages for analytics
This tests your grasp of OLAP vs. OLTP data modeling. A great answer defines fact/dimension tables, explains how denormalization leads to fewer joins and faster queries, and contrasts this with 3NF's focus on write integrity.
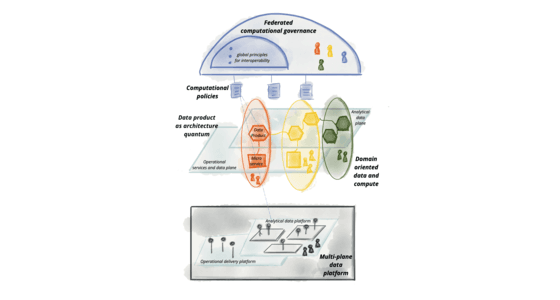
Design a Scalable Data Governance Framework
This tests your grasp of decentralized data architectures like Data Mesh. A great answer proposes a federated model with domain ownership, data as a product, and a self-serve platform.

What is a data schema and why enforce it on ingestion?
This tests your understanding of data contracts. A great answer defines a schema as a data blueprint, then explains how early enforcement prevents bad data, ensuring consistency and reliability for analytics. A red flag is only defining the term.

Design a framework for ensuring data quality and integrity
This tests your ability to design a proactive, multi-layered data quality system, not just reactive fixes. Start with governance (roles/ownership), then detail profiling, validation, and cleansing. Finally, discuss lineage. Red flag: focusing only on one tool.
What is data partitioning in a cloud data warehouse?
Tests your grasp of physical data layout optimization. A good answer defines partitioning as dividing a table by a column (e.g., date), then explains how this enables partition pruning to improve query speed and reduce cost by scanning less data.
Star vs. Snowflake Schemas: Trade-offs
Tests your grasp of data warehouse design trade-offs. Define star (denormalized, fast queries) and snowflake (normalized, storage efficient) schemas. Explain the core trade-off: star's query speed vs. snowflake's storage/integrity.

What is a data warehouse vs. a transactional database?
Tests your grasp of systems optimized for different access patterns (writes vs. reads). Define OLTP for transactions and OLAP for analytics. Contrast their schema (normalized vs. denormalized), data, and workload. A red flag is calling it a 'big database'.
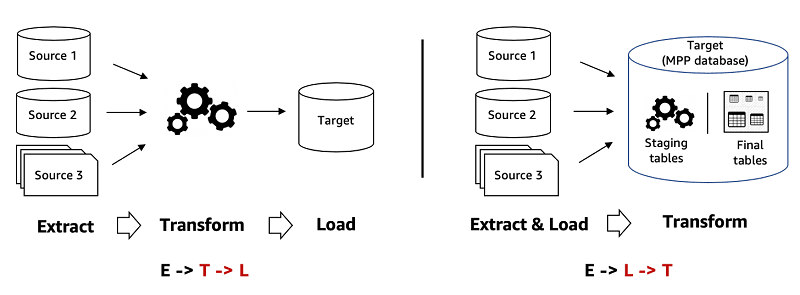
ETL vs. ELT: Key Differences and When to Use Each
This tests your grasp of data pipeline trade-offs. Define ETL (transform first) vs. ELT (load first), contrasting transform location and data state. A red flag is ignoring how cloud warehouses make ELT the modern default for flexibility.
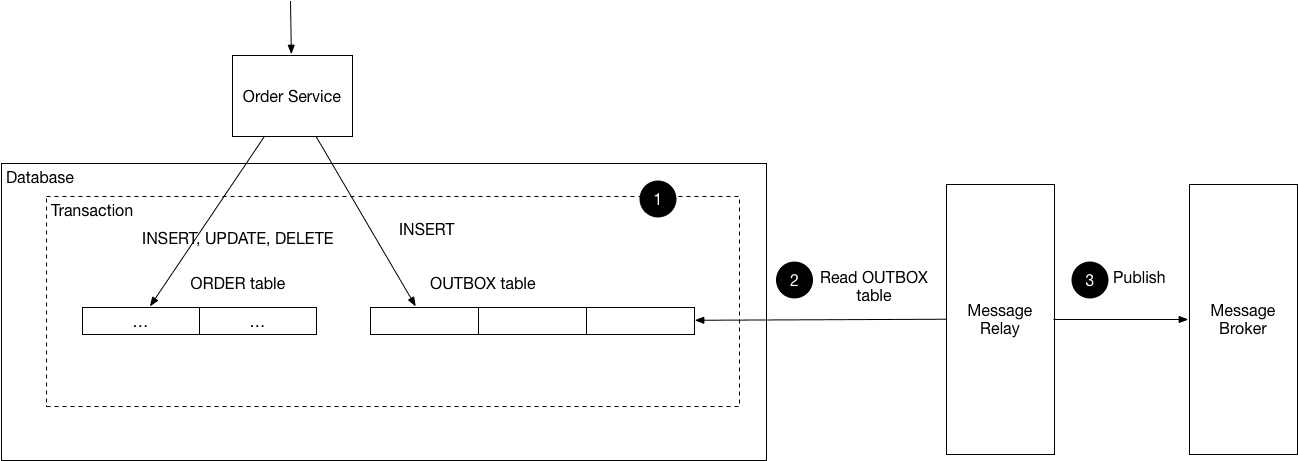
Guarantee at-least-once delivery for a critical analytics event?
Tests reliable messaging patterns to avoid dual-write issues. Propose the Transactional Outbox pattern: atomically write business data and the event to a DB outbox table. A separate relay process then sends the event.

Design a Client-Side Event Batching System
Tests your grasp of client-side performance, network optimization, and data loss edge cases. A great answer batches events in memory, sends them with `fetch()`, and uses `navigator.sendBeacon()` on `pagehide` to reliably send the final batch.