Design a system to detect sudden add-to-cart drops in real time
This tests streaming pipeline design and seasonality-aware anomaly detection. Outline Kafka or Kinesis ingestion, windowed aggregations, and ML baselines tuned to hourly and weekly trends. Red flag: static thresholds that ignore daily patterns.
What's really being asked
This question evaluates whether you can design a real-time data pipeline for high-volume ecommerce events and choose an anomaly-detection strategy that respects complex seasonality. Interviewers want to see that you understand streaming ingestion, stateful windowing, and the difference between static thresholds and adaptive baselines that learn from historical patterns.
The full answer
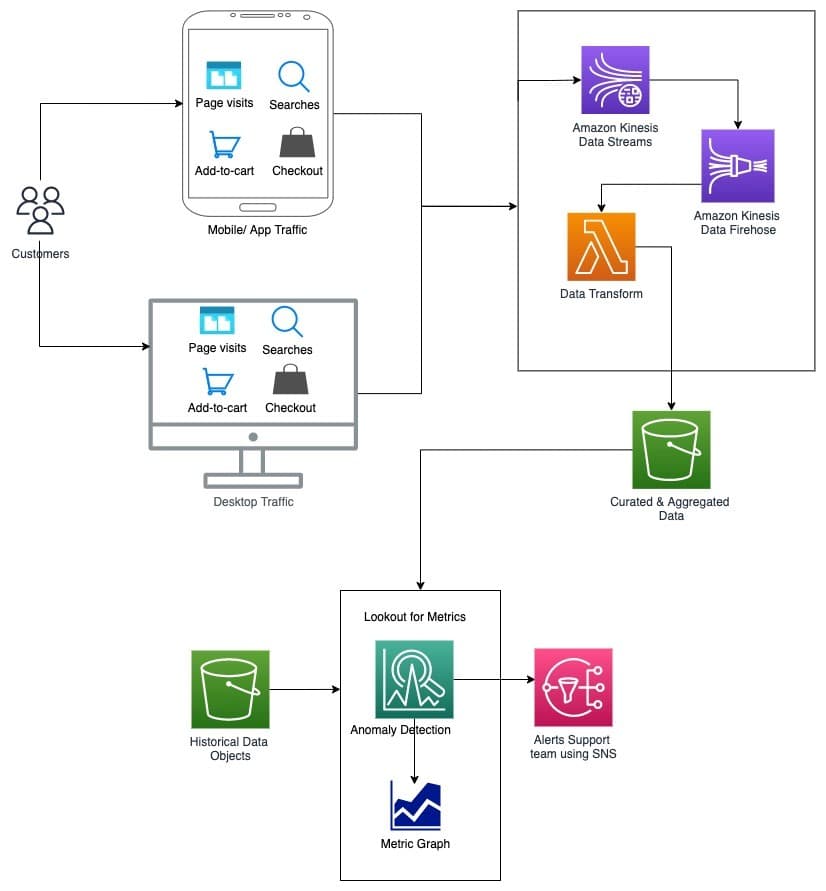
First, event streaming and ingestion using a scalable platform like Apache Kafka or Amazon Kinesis Data Streams that can handle high throughput and partition events by user action or timestamp. Second, transformation and storage using Kinesis Data Firehose with AWS Lambda to normalize add-to-cart events and land them in Amazon S3 for historical training data while keeping a hot path for real-time analysis. Third, algorithmic detection that avoids false positives by using ML-based services such as Amazon Lookout for Metrics or self-hosted statistical models that learn hourly, daily, and weekly trends; the algorithm should compare current windowed counts against predicted baselines derived from the same hour and day of week over multiple weeks, and it should incorporate feedback loops to tune sensitivity over time. Fourth, notification via Amazon SNS or similar to alert on-call engineers when a statistically significant deviation persists across multiple consecutive windows rather than a single blip.
The mistakes people make
Proposing a simple percentage drop threshold without accounting for daily cyclicality or holiday spikes like Black Friday. Ignoring the need for historical data storage and retraining, which causes models to drift. Choosing batch-only processing instead of streaming, which introduces latency that makes real-time outage detection impossible. Failing to mention feedback mechanisms that let operators mark false positives so the system improves.
What usually comes next
How would you handle a gradual degradation versus a sudden cliff? What happens if the anomaly is caused by a legitimate traffic shift such as a marketing campaign ending? How do you balance cost between running your own statistical models versus a managed ML service? How would you backfill and retrain the baseline after a known outage skews the historical data?
A concrete example
An ecommerce site ingests add-to-cart events into Kinesis Data Streams with one-minute tumbling windows. Firehose transforms the events and writes aggregates to S3. Lookout for Metrics consumes the stream and compares the current minute's count against a baseline learned from the prior eight weeks of the same weekday and hour. If the count drops below two standard deviations for three consecutive minutes, SNS pages the platform team. The team can then flag the alert as a true outage or a false positive, and Lookout for Metrics adjusts future sensitivity accordingly.
Interview question
When should the on-call team be paged for a sudden add-to-cart drop?
- a.Whenever an operator marks a pattern as anomalous in the feedback dashboard
- b.As soon as a single window shows a 50% drop from the previous hour's average
- c.Only after a statistically significant deviation persists across multiple consecutive windows compared with a baseline tuned to the same hour and day of weekCorrect
- d.Once daily batch aggregates show a significant deviation from the prior day's totals
Why? this is the answer
The card specifies that alerts should fire only when a deviation persists across multiple consecutive windows against an adaptive baseline that learns from the same hour and day of week. Option B is tempting because a sharp single-window drop feels urgent, but it ignores daily cyclicality and causes false positives.
Just read this? Test yourself on what you have been reading.
Read the original → aws.amazon.com
- #streaming
- #anomaly-detection
- #ecommerce
- #kinesis
- #lookout-for-metrics
You just looked this up. Could you explain it out loud?
That is the part interviews actually test. Tezvyn takes questions like this one and gives you what the interviewer is really checking, the answer that lands, and the mistake that ends the conversation, in the four minutes before your next meeting.
The iPhone app is on the way
We are building it. Until it lands, nothing here is held back from you: every interview card, your saved cards, streaks and the job board all work in Safari, plus hundreds of free practice quizzes of thirty questions each. Sign in and it all carries over to the app the day it arrives.
Want it as an icon? Tap Share at the bottom of Safari, then Add to Home Screen. It opens full screen and the cards you have read stay available offline.
We are hiring for this. Open roles that interview on streaming — each one lists the topics its interview covers.
See open roles