
Explain the North Star Metric and propose one for a product
Tests your ability to connect user value to business outcomes. A great answer defines the NSM, proposes one for a product (e.g., Spotify), and justifies how it links customer value to business success. A red flag is picking a vanity metric like DAU or revenue.

How would you diagnose why a new feature isn't being adopted?
This tests your ability to diagnose a flat KPI. A great answer outlines a funnel (awareness, activation, usage) and combines quantitative data with qualitative insights from session replays. A red flag is proposing solutions without a diagnostic plan.

Translate 'increase engagement' into a technical measurement plan
This tests your ability to translate a vague business goal into a structured, measurable technical plan. Clarify the goal with the PM, define a primary metric and supporting metrics, then create an instrumentation spec.

When is A/B testing not feasible, and what is an alternative?
Tests your grasp of causal inference when randomization isn't possible. A great answer names a scenario (like a regional launch), proposes Difference-in-Differences (DiD), and explains its core 'parallel trends' assumption.

Calculate MRR from a subscriptions table using SQL
Tests your ability to translate a business metric (MRR) into a precise SQL query. A great answer filters for active subscriptions this month and sums their prices, correctly amortizing annual plans.

What does a p-value of 0.03 mean in an A/B test?
This tests your practical grasp of statistical significance. A good answer defines p-value (probability of the result if the null hypothesis is true), explains that p=0.03 is significant vs. alpha=0.05, and concludes you can reject the null.
How do you handle timezones for a daily global sales report?
This tests your understanding of time data modeling and business requirements. A good answer stores events in UTC with a timezone identifier, then converts to the business's chosen 'day' at query time. A red flag is storing local time without context.

Propose a multi-touch attribution model and its data pipeline
Tests your grasp of attribution models and their data engineering needs. Propose a rule-based model (e.g., time-decay), outline the data pipeline for it, and acknowledge privacy-driven signal loss. A red flag is ignoring the challenge of identity resolution.

Calculate Daily Active Users (DAU) with SQL
This tests product sense and SQL fundamentals. Define 'active' with a core product action, describe the event data needed, then write a COUNT(DISTINCT user_id) query. A red flag is writing SQL before defining the business logic for 'active'.

How would you build a SQL query for a conversion funnel?
Tests your ability to translate a business need into a technical SQL solution. A good answer uses CTEs or LEFT JOINs to model sequential steps, counts users at each stage, and discusses attribution.

Trade-offs: Bundled vs. Warehouse-Native Product Analytics
This tests your grasp of modern data stack architecture. A great answer weighs trade-offs in data control, cost, query flexibility, and team capabilities. A red flag is ignoring total cost of ownership and engineering overhead for a warehouse-native setup.
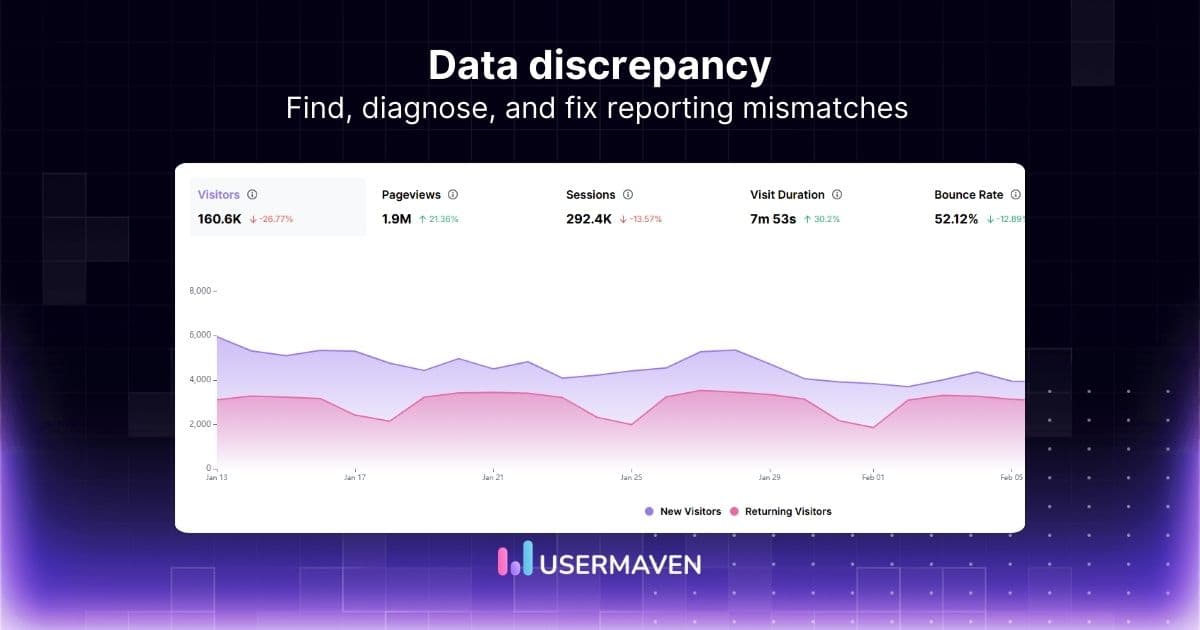
Why don't analytics and backend user counts match?
This tests your systematic debugging and understanding that 'user' has different definitions. A good answer first defines 'user' in each system, then investigates tracking implementation, timing differences, and filtering.
Architect a Multi-Touch Attribution System
This tests your grasp of modern data challenges like signal loss. A good answer discusses data ingestion, identity resolution, and model trade-offs. A red flag is focusing only on the algorithm and ignoring the data pipeline's fragility.
Calculate a 3-step user onboarding funnel with SQL
Tests your ability to translate a business need into a robust data query. A great answer clarifies funnel logic (attribution, timing), defines the user cohort, finds each user's first event for each step, and then calculates conversion.
What is the 'multiple comparisons problem' in A/B testing?
Tests your grasp of statistical pitfalls in large-scale A/B testing. Define the problem (inflated false positives), explain the business risk (wasted effort), and propose a mitigation like Bonferroni correction.

Visualizing Load Time vs. Session Duration with a Third Variable
Tests your ability to visualize correlation and add dimensions. A great answer suggests a scatter plot for the initial relationship, then uses color to segment by the categorical third variable (network type).
.png&w=3840&q=75)
Cohort Analysis for a New Onboarding Flow
Tests applying analytics to measure impact. Define a cohort, then compare a pre-launch (Dec) vs. post-launch (Jan) acquisition cohort, tracking retention over time. A red flag is using aggregate metrics, which hide the true impact of the change.

How would you visualize a complex, multi-stage user funnel?
Tests product sense and data viz literacy. A good answer proposes a Sankey/Alluvial diagram to show non-linear flows, explains how it visualizes drop-off and re-entry, and notes the data needs. A red flag is just suggesting a better standard funnel chart.
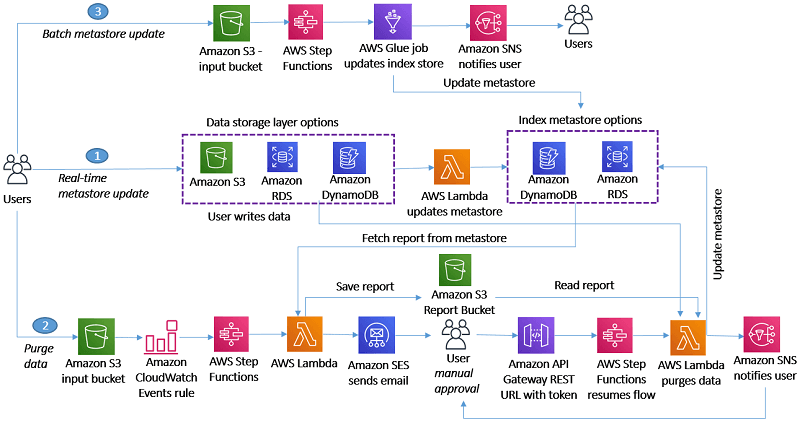
Design a GDPR 'Right to be Forgotten' System
Tests your ability to design a verifiable data deletion system. A good answer outlines an index metastore, an orchestrated workflow, and auditing. A red flag is focusing only on the primary database, ignoring the data lake, warehouse, and caches.

Describe AARRR and apply it to B2B vs. B2C analytics
Tests applying the AARRR framework to different business models. Define AARRR, then apply to B2B SaaS (account-level activation) vs. a B2C game (user-level virality). Red flag: using generic metrics that ignore the context of B2B sales vs. B2C usage.