More in Product Management — page 18
Sessionization: Bounding Events into Visits
Sessionization groups raw user events into visits using idle timeouts. Teams use it to measure engagement and attribute conversions per sitting. The footgun is treating sessions as users, which inflates counts and wrecks retention analysis.
HEART Framework: Five Metrics for Product Health
HEART is a vital-signs panel for product health, not a single score. Use it to pick metrics for feature launches so you track user value, not vanity numbers. Measuring all five dimensions when only one matters creates dashboard bloat and analysis paralysis.
PPC: Buying Intent, Not Attention
PPC buys intent, not attention: you bid to appear when someone searches for what you sell, paying only if they click. Use it for high-intent offers like B2B software where organic reach is slow.

Apply AARRR to B2B SaaS vs B2C mobile game analytics
This tests mapping AARRR to instrumentation across business models. A strong answer contrasts B2B account activation and expansion against B2C session-zero funnels and whale monetization. Red flag: same metrics ignoring account hierarchies and ad attribution.
What is the difference between a metric and a KPI?
Tests strategic vs operational measurement discernment. Answer: KPIs track critical goals; metrics track processes. Page views are a metric; conversion rate is the KPI. Red flag: calling all data KPIs or using page views as success proof.
Design column-level data lineage from source to dashboard
WHAT IT TESTS: Metadata architecture tracing columns through heterogeneous batch and SQL engines. ANSWER OUTLINE: Propose AST extractors for Spark and dbt, a graph DB for column edges, and an API for impact analysis.

How do you root-cause a 20% revenue drop with no pipeline failures?
WHAT IT TESTS: Incident leadership and validating data integrity before calling a downturn. ANSWER OUTLINE: Reconcile against raw events, slice by dimension for silent gaps, audit schema drift.
Design a self-service analytics platform for non-technical users
Tests separation of semantic modeling, UI, and query generation for safe self-service analytics. Strong answers cover a semantic layer with unified metrics, drag-and-drop UI with AST-based SQL generation, and caching.
How would you design an automated data quality monitoring system?
Tests turning data quality into tiered checks for exec dashboards. Strong answers combine freshness, volume, schema, and distribution validation with severity-based paging. Red flag: static thresholds without noise reduction or business-impact triage.

Propose a technical architecture for a centralized Metrics Layer or Metrics Store
This tests your ability to decouple metric semantics from storage and query tools. A strong answer outlines a semantic layer with versioned definitions, a query API, and enforced downstream consumption.
Instrument a mobile event and surface it in analytics
This tests full-stack analytics plumbing. A good answer hits: structured client logging, batched transmission, backend validation, warehouse aggregation, and dashboard verification. A red flag is fire-and-forget logging with no schema checks or reconciliation.
What data do you need and what steps build a WAU dashboard?
Tests defining a metric, modeling events, and wiring them into a BI tool. A strong answer names the feature event, sets a rolling 7-day window, counts distinct users by period, and configures the BI layer. Red flag: jumping to charts before defining active.
Design an A/B test separating novelty from true long-term impact
Tests distinguishing novelty from stable effects. Strong answer: staggered rollout with difference-in-differences comparing early and late adopters over weeks. Red flag: extending the A/B test without modeling time-interaction or control maturation.
Design a real-time mobile analytics pipeline
Tests decoupling high-volume ingestion from low-latency querying. Strong designs use an event broker, a stream processor for windowed aggregates, and an OLAP database for sub-second dashboards.

Design a data model for feature adoption tracking
Tests dimensional modeling for high-volume events so PMs can query Feature A not B without complex SQL. A strong answer uses an event fact table plus a materialized user-feature summary. Red flag: a wide user table with boolean columns per feature.

Explain cohort retention and write a pseudo-query for May signups
Tests cohort retention vs aggregate DAU and SQL self-joins for Week 1, 2, and 4 retention from May signups. Strong answers define cohorts by signup date, use datediff, and left-join activity. Red flag: using calendar week instead of relative signup date.

Describe client-side events and properties to track Export to CSV usage
This tests telemetry design for async actions. A strong answer defines three custom events—click, success, failure—with properties like location, file_size, error_code, and user_id, fired at the right lifecycle moments.
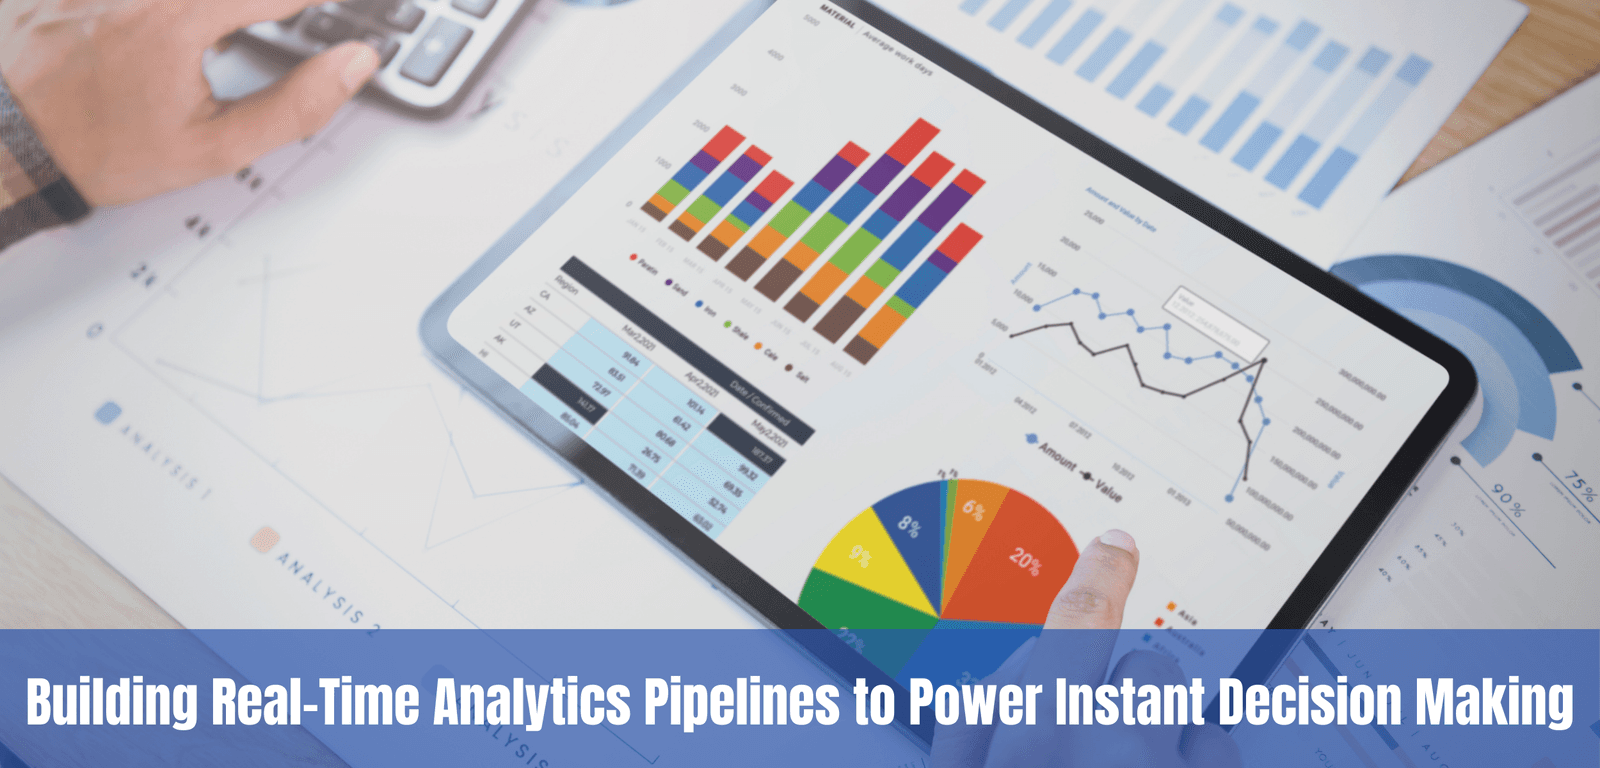
Design a near real-time pipeline to monitor orders per minute
Tests stream architecture and batch trade-offs. Outline: Kafka or Kinesis ingestion, Flink with tumbling windows, Druid or Pinot storage, Grafana alerts. Contrast batch on latency, exactly-once semantics, and cost. Red flag: calling cron SQL real-time.
How do you optimize a data warehouse for billions of rows?
Tests physical design in columnar warehouses at scale. Strong answers cover partition and cluster pruning, materialized views or rollups to reduce joins, caching and search indexes for hot paths, and reserved slots or autoscaling.

Describe dbt's role and how it differs from traditional ETL
TESTS: Declarative warehouse transformation vs imperative ETL. OUTLINE: Position dbt as ELT's T with lineage, tests, docs; contrast with Python ETL using external compute and Airflow only scheduling tasks.