
Describe AARRR and apply it to B2B vs. B2C analytics
Tests applying the AARRR framework to different business models. Define AARRR, then apply to B2B SaaS (account-level activation) vs. a B2C game (user-level virality). Red flag: using generic metrics that ignore the context of B2B sales vs. B2C usage.

What's the difference between a metric and a KPI?
This tests your ability to connect technical measurements to strategic business outcomes. A great answer defines both, notes KPIs are a subset of metrics tied to goals, and gives a concrete example like page views (metric) vs. conversion rate (KPI).

Investigate a 20% drop in a key revenue metric
This tests your ability to lead a high-pressure investigation. A great answer confirms the drop, traces data from dashboard to source, and differentiates bugs from business trends. A red flag is jumping to conclusions without a systematic, layered approach.
Design a Real-Time Analytics Pipeline for Mobile Events
Tests your grasp of low-latency, high-throughput design. A strong answer outlines ingestion (Kafka), stream processing (Flink), and a real-time OLAP database (Druid/ClickHouse). A red flag is proposing a slow, batch-only architecture.

Design a data warehouse model for tracking feature adoption
This tests your grasp of data warehousing star schemas for efficient behavioral analysis. A strong answer proposes a central `events` fact table linked to `users`, `features`, and `time` dimension tables.

Explain cohort analysis for user retention and write a pseudo-query
Tests your ability to use precise metrics. A good answer defines a cohort, explains why it isolates variables better than aggregate data, outlines the calculation, and provides a clear pseudo-query.

Track an 'Export to CSV' button's usage and outcomes
This tests your ability to design a robust event schema, not just track a click. A great answer uses one custom event name with a 'status' parameter ('initiated', 'success', 'failure'). A red flag is suggesting multiple event names for one action.
Design a near real-time analytics pipeline for a critical metric
This tests your grasp of stream processing trade-offs (latency, cost, correctness). Outline a 4-stage pipeline (ingest, process, store, visualize) with specific tech choices, contrasting its low-latency, high-cost nature with batch.
How would you optimize a slow, expensive data warehouse?
Tests your diagnostic approach to performance issues. A good answer first analyzes query patterns, then applies partitioning by date, clustering by high-cardinality keys, and materialized views for aggregations.

Describe dbt's role in a modern analytics stack
Tests your grasp of the ELT paradigm and applying software engineering principles to data. A good answer defines dbt as the 'T' in ELT, contrasts its in-warehouse SQL approach with traditional ETL, and clarifies its relationship with orchestrators like…

Track a user event from frontend code to a BI tool
Tests your understanding of the modern data stack. A good answer traces the event from frontend capture, through an ingestion pipeline, into a data warehouse, and finally to a BI tool for analysis. A red flag is describing only one part of the journey.

Prove API Latency Affects User Engagement
This tests your ability to design a controlled experiment for a backend attribute. A great answer outlines an A/B test that artificially adds latency for a treatment group, details the necessary logging with shared IDs, and explains how to join and analyze…
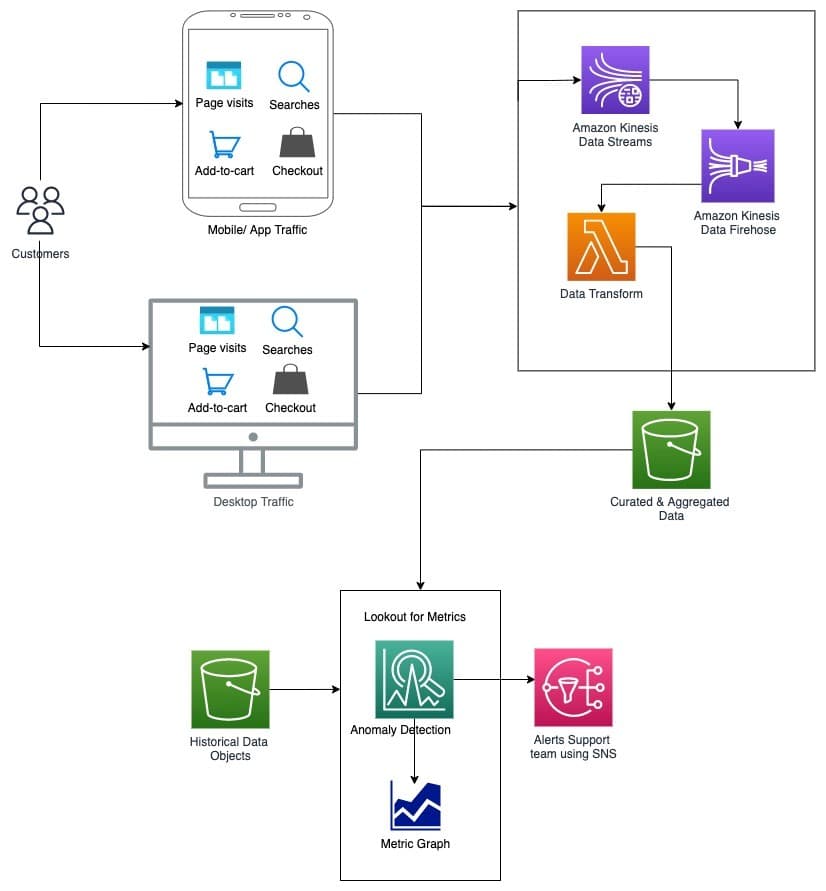
Design a real-time anomaly detection system for 'add to cart' events
Tests real-time data pipeline design and nuanced anomaly detection. A good answer outlines ingestion (Kinesis), processing (Lambda/Flink), seasonal modeling for 'a drop', and alerting (SNS).

Forecasting inventory with trend and weekly seasonality?
This tests mapping a business problem to a statistical tool. A good answer names Holt-Winters, explains its level, trend, and seasonal components, and discusses additive vs. multiplicative seasonality.
Train-test split vs. time-series cross-validation?
Tests if you see why temporal data breaks random splits. Contrast random sampling with sequential 'walk-forward' validation, where you only use past data to predict the future.
How would you measure a sales forecast model's accuracy?
This tests your ability to connect statistical metrics to business impact. A great answer defines MAE (linear error cost) and RMSE (penalizes large errors), explains the choice depends on business context, and stresses using a test set.

How does CUPED increase the statistical power of an experiment?
Tests your grasp of variance reduction. Explain CUPED as ANCOVA, using pre-experiment data (X) to remove predictable noise from the outcome (Y). Effectiveness depends on correlation (rho), reducing variance by (1-rho^2).
Primary vs. Guardrail Metrics in Experiments
This tests if you can balance improving a key metric with not harming the user experience. Define primary (the goal) and guardrail (don't harm) metrics. Give an example where a guardrail regression (e.g., latency) blocks a feature ship.
Why is stopping an A/B test when it hits significance problematic?
Tests your understanding of the 'peeking problem' in A/B testing. A great answer defines peeking, explains how it inflates the Type I error rate (false positives), and states the need for a predetermined sample size.
How would you A/B test a 'Buy Now' button color change?
This tests structured thinking. A good answer defines a hypothesis, selects primary and guardrail metrics, and outlines the experiment's duration and analysis plan. A red flag is focusing only on clicks without considering business impact.