Design a system correlating CI/CD deployments with observability metrics
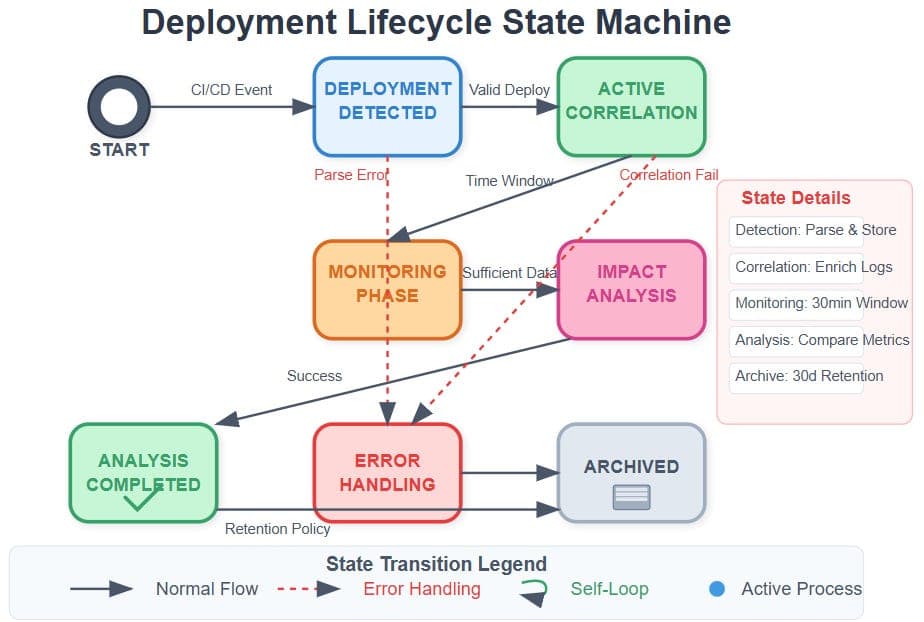
Tests event-driven correlation and temporal join patterns across distributed data. Strong answers outline: async deploy event ingestion, time-windowed metric joins with version tags, and handling clock skew.
What's really being asked
This question tests your ability to design event-driven integrations between disjoint systems, specifically joining discrete deployment events with continuous time-series metrics. Interviewers care about temporal correlation, data model design, and operational concerns like clock skew and idempotency. They want to see you treat deployment context as first-class metadata rather than an afterthought.
The full answer
First, an async ingestion path for deployment events, typically via webhooks from the CI/CD platform into a message queue like Kafka or an event bus, decoupling the systems. Second, a correlation engine that stores deployment metadata, service version, commit SHA, and timestamp, then exposes it as annotation markers or enriched labels to the observability platform. Third, metric enrichment strategies: either backfilling version tags onto raw metrics via scheduled joins, or preferably injecting version identifiers at the source so every metric emits with a version label. Fourth, handling time alignment by using bounded time windows, monotonic clocks, or NTP synchronization to account for skew between the CI/CD clock and the observability agent clock. Fifth, idempotency and deduplication, since rollback events or retrying pipelines must not create duplicate deployment records that skew before-and-after comparisons.
The mistakes people make
A major red flag is suggesting the observability platform should poll the CI/CD API every few minutes; this introduces lag and misses canary deployments that last seconds. Another is proposing a single global timestamp without accounting for cross-region clock skew or processing delays. Candidates also err by designing a blocking synchronous call from the deployment pipeline to the metrics store, which couples availability and risks failing a production deploy if the observability backend is slow.
What usually comes next
Interviewers often ask how you would handle canary deployments where only five percent of traffic runs the new version, requiring metric segmentation by instance or pod labels. They may probe query performance, asking how to index deployment markers in a time-series database without exploding cardinality. Another follow-up is fault tolerance: how does the system behave if the event bus is down during a deployment?
A concrete example
Imagine a service deployed via GitHub Actions. On deploy, a webhook publishes an event containing service name, version v2.3.1, region, and timestamp to Kafka. A correlation consumer writes this to a deployment registry. The observability backend, Prometheus, scrapes metrics that already carry a version label injected by the runtime. A dashboard query joins the deployment registry with the request latency metric, grouping by version. When v2.3.1 deploys in us-east-1 at 14:03 UTC, the latency graph automatically splits into pre-deploy and post-deploy series, revealing a twenty percent regression within the first two minutes.
Interview question
When correlating deployment events with observability metrics across distributed systems, how should you handle potential clock skew?
- a.Normalize all timestamps to the observability backend's local clock
- b.Trust a single global timestamp from the CI/CD platform
- c.Buffer metrics for five minutes to wait for the corresponding deployment event
- d.Use bounded time windows, monotonic clocks, or NTP synchronizationCorrect
Why? this is the answer
Bounded time windows, monotonic clocks, or NTP synchronization explicitly reconcile differences between the CI/CD and observability agent clocks. Trusting a single global timestamp ignores cross-region skew and processing delays, which is a red flag.
Just read this? Test yourself on what you have been reading.
Read the original → sdcourse.substack.com
- #ci/cd
- #observability
- #event-driven
- #system-design
- #metrics
You just looked this up. Could you explain it out loud?
That is the part interviews actually test. Tezvyn takes questions like this one and gives you what the interviewer is really checking, the answer that lands, and the mistake that ends the conversation, in the four minutes before your next meeting.
The iPhone app is on the way
We are building it. Until it lands, nothing here is held back from you: every interview card, your saved cards, streaks and the job board all work in Safari, plus hundreds of free practice quizzes of thirty questions each. Sign in and it all carries over to the app the day it arrives.
Want it as an icon? Tap Share at the bottom of Safari, then Add to Home Screen. It opens full screen and the cards you have read stay available offline.
We are hiring for this. Open roles that interview on ci/cd — each one lists the topics its interview covers.
See open roles