How can EDA and visualization identify dataset bias before modeling?
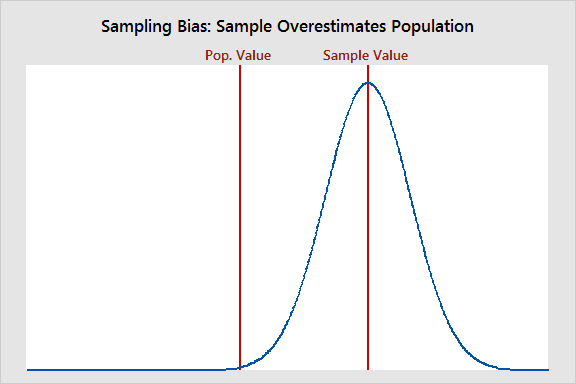
Tests operationalizing bias detection before modeling. Strong answers compare sample distributions to population norms, audit feature coverage with heatmaps, and track missingness by subgroup. Red flag: citing only class imbalance or ignoring sampling frame.
What's really being asked
This question tests whether you can operationalize statistical bias theory into a reproducible exploratory data analysis workflow. Interviewers want to see that you distinguish sampling bias, which is a systematic distortion between sample and population, from random noise or model error. They also want evidence that you validate data before training rather than treating bias as a post-modeling fairness problem.
The full answer
First, benchmark your sample against the population. Use cumulative distribution functions, QQ plots, or histogram overlays to compare age, income, or geographic distributions against census or known market data. Second, audit feature coverage and correlation structure across subgroups. Use heatmaps or mosaic plots to check whether certain demographics have sparsely populated features or different correlation patterns that signal undercoverage. Third, analyze missingness patterns. Plot missingness by subgroup and data collection source to detect nonresponse bias or attrition, since subjects with specific characteristics may be less likely to participate or complete surveys. Fourth, validate temporal, geographic, or source splits. If data is collected over time or from multiple vendors, visualize participation rates and feature drift across these dimensions to catch self-selection or convenience sampling artifacts.
The mistakes people make
Treating class imbalance as synonymous with sampling bias. Class imbalance is a label distribution issue; sampling bias is a systematic misalignment between your sample and the target population. Another red flag is suggesting bias detection only after model training using fairness metrics like equalized odds. This misses the point because biased data propagates into features before any model is fit. A third error is ignoring the sampling frame entirely, such as assuming an online survey represents an entire city without comparing respondents to census demographics.
What usually comes next
How would you weight or resample to correct for a known underrepresented subgroup? What would you do if population benchmarks do not exist? How do you distinguish representation bias from label noise or feature measurement error? When is it acceptable to intentionally oversample a subgroup, and how does that change your analysis?
A concrete example
Suppose you are building a healthcare model using patient survey data collected at clinics. You plot age and income distributions against regional census data and notice that respondents skew ten years older and thirty percent higher income than the general population. A heatmap of missingness by clinic location reveals that rural clinics have forty percent more missing chronic condition fields than urban clinics, suggesting nonresponse or ascertainment bias. A mosaic plot of insurance type by clinic shows that uninsured patients are underrepresented by a factor of three relative to the county population. Before modeling, you flag that the sample frame excludes homebound patients and weight rural responses upward, or you restrict model generalization to populations resembling the biased sample.
Interview question
During pre-modeling EDA, which finding most strongly indicates systematic sampling bias rather than class imbalance or random noise?
- a.Missing values in a key feature are uniformly distributed across all demographic subgroups
- b.The target label shows a 90/10 class distribution
- c.Subgroup parity of predicted probabilities falls below an acceptable threshold on validation data
- d.A QQ plot against census data shows systematic quantile shifts in age and incomeCorrect
Why? this is the answer
QQ plots against census benchmarks reveal systematic distortion between the sample and population, which defines sampling bias. Class imbalance is only a label distribution issue, and predicted-probability parity is a post-modeling metric that misses data-level bias before training.
Just read this? Test yourself on what you have been reading.
Read the original → statisticsbyjim.com
- #data science
- #sampling bias
- #EDA
- #visualization
- #model validation
You just looked this up. Could you explain it out loud?
That is the part interviews actually test. Tezvyn takes questions like this one and gives you what the interviewer is really checking, the answer that lands, and the mistake that ends the conversation, in the four minutes before your next meeting.
The iPhone app is on the way
We are building it. Until it lands, nothing here is held back from you: every interview card, your saved cards, streaks and the job board all work in Safari, plus hundreds of free practice quizzes of thirty questions each. Sign in and it all carries over to the app the day it arrives.
Want it as an icon? Tap Share at the bottom of Safari, then Add to Home Screen. It opens full screen and the cards you have read stay available offline.
We are hiring for this. Open roles that interview on data science — each one lists the topics its interview covers.
See open roles