OLAP Cube Operations
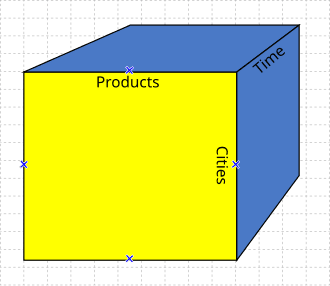
OLAP cube operations let you analyze data like a multi-dimensional spreadsheet. Instead of just rows and columns, you navigate dimensions like time and location. Used in business intelligence to answer complex analytical questions.
WHY IT EXISTS: Standard databases store data in two-dimensional tables (rows and columns), which makes it hard to analyze from multiple perspectives at once. OLAP cubes were created to structure data in a multi-dimensional array, allowing for fast, complex analysis and the discovery of business insights.
THE MENTAL MODEL: Imagine an Excel workbook where the sheet isn't just a 2D grid but a 3D, 4D, or even higher-dimensional cube. The dimensions might be Time, Product, and Geography. The cells of the cube hold aggregated measures, like 'Total Sales' or 'Units Sold'. Operations on the cube are like pivoting, filtering, and drilling into this data structure, not just querying rows.
HOW IT WORKS: An OLAP cube is a data structure optimized for analysis. Instead of storing raw transactions, it typically stores pre-aggregated data. Operations involve navigating its dimensions. For example, you can look at the entire cube (total sales), then focus on a specific slice (sales in 2023), and then dice that slice further (sales in 2023 for a specific product in the Northeast). You can also change the level of detail, like moving from quarterly sales to monthly sales, or from city-level data to state-level data. These actions allow for rapid exploration without writing complex SQL queries for every view.
WHEN TO USE IT: Use it for business intelligence, reporting, and any scenario requiring analysis on aggregated historical data. It's ideal for answering questions that involve multiple business facets, like "Compare the sales performance of our top 5 products across all regions for the last two years."
WHEN NOT TO USE IT: Do not use OLAP for Online Transactional Processing (OLTP) systems. It is not designed for high-frequency writes, updates, or deletes, such as recording individual customer orders, processing payments, or managing inventory in real-time. The data in a cube is typically read-only and refreshed periodically.
ONE CANONICAL EXAMPLE: A retail company has a sales cube with dimensions for Time, Store, and Product, and a measure for Sales Amount. An analyst can perform an operation to "slice" the cube to see data for only 'Q4 2023'. They can then "dice" it by selecting 'Electronics' from the Product dimension and 'New York' from the Store dimension to see the specific sales amount for that combination.
Read the original → en.wikipedia.org
Get five bites like this every day.
Tezvyn delivers a daily feed of 60-second tech bites with quizzes to lock in what you learn.