All bites
The whole library, newest first. Filter by what you are here for, or pick a topic if you already know.
4247 bites
Page 161
Uplift Modeling: Who to Target, Not Just Who Will Convert
Uplift modeling finds who to target by predicting the *change* in behavior from an action, not just the final outcome. It's used in marketing to decide who gets a discount, optimizing spend. The footgun is confusing it with a simple conversion model.

Probability Distributions: Mapping Odds to Outcomes
A probability distribution is a map of all possible outcomes and their chances. It's used to model everything from coin flips to customer churn. The footgun is assuming a simple bell curve when reality is often skewed or unpredictable.

Vector Spaces: A Playground for Vectors
A vector space is a collection of vectors with strict rules for how they can be added or stretched. It's the foundation for linear algebra, used in graphics and physics. The footgun: not every set of vectors forms a valid space.
Bayes' Theorem: Updating Beliefs with Evidence
Bayes' Theorem updates your belief in a cause after seeing new evidence. It's used in medical diagnostics to interpret test results and in spam filters. The common footgun is ignoring the base rate—how likely the cause was *before* the evidence appeared.
Linear Regression: Finding the Line of Best Fit
Linear regression draws the 'line of best fit' through your data to predict outcomes. It's used to estimate continuous values, like forecasting sales based on ad spend or predicting a house's price from its size. The main footgun: correlation is not causation.
Hypothesis Testing: A Courtroom for Your Data
Hypothesis testing is a courtroom trial for a claim. You assume 'no effect' (the null hypothesis) and see if your data is strong enough to reject it. The footgun is misreading the p-value: it only measures evidence against the null, not for your alternative.

Matrices: The Language of Linear Transformations
A matrix is a grid of numbers representing a linear transformation, like stretching or rotating space. It's used in graphics to move 3D models and in machine learning to hold data. The footgun: don't just see numbers; see the transformation it encodes.
Eigenvectors and Eigenvalues: The Unchanging Directions of a Transformation
Eigenvectors are the special vectors a transformation only stretches, not rotates; the eigenvalue is the stretch factor. They're the backbone of PCA for dimensionality reduction and Google's PageRank.
Gradient Descent: Finding the Bottom of the Hill
Think of finding the lowest point on a foggy hill by taking steps in the steepest downward direction. It's how machine learning models learn, by iteratively minimizing a cost function. The footgun is the step size: too large overshoots, too small is too slow.
Chain Rule: Unpacking Nested Rates of Change
The chain rule is like Russian nesting dolls for rates of change. To find the derivative of a nested function, you multiply the derivatives of the 'outer' and 'inner' functions. It's the engine behind backpropagation in neural networks.
MLE: Find the Parameters That Make Data Likely
MLE tunes your model until observed data looks inevitable. Use it to fit distributions to logs, traffic, or errors. The footgun: it assumes your distribution family is correct; under a wrong model, it finds the best-fitting wrong answer with high confidence.

SVD: Eigendecomposition for Any Matrix
SVD treats any matrix as rotation, then scaling, then rotation. It generalizes eigendecomposition beyond square normal matrices to any real or complex matrix.
The Jacobian Matrix: A Derivative for Multiple Dimensions
The Jacobian matrix is the multi-dimensional version of a derivative. It's a grid of partial derivatives showing how a small change in each input locally affects each output of a vector function. Don't confuse the matrix with its determinant.
NumPy ndarray: Fast, Typed, Multidimensional Grids
A NumPy ndarray is a fast, memory-efficient grid for numbers of a single type. It's the backbone for scientific computing, used for image data to ML model weights. The main footgun: slicing often creates a view, not a copy, so edits can alter the original.
pandas DataFrame: A Spreadsheet in Code
Think of a pandas DataFrame as a powerful spreadsheet you control with code. It's the workhorse for loading, cleaning, and analyzing tabular data in Python, like sales figures from a CSV.
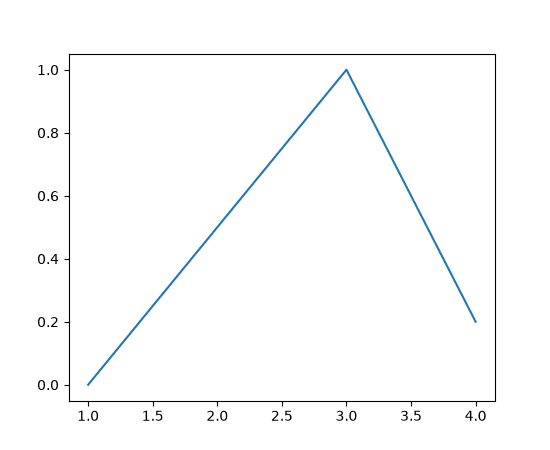
Matplotlib's Object-Oriented API: Explicit Plot Control
Instead of the stateful plt.plot(), Matplotlib's OO API gives you explicit control by creating Figure and Axes objects to call methods on, like ax.plot(). This is crucial for complex plots with multiple subplots. The footgun is mixing styles.
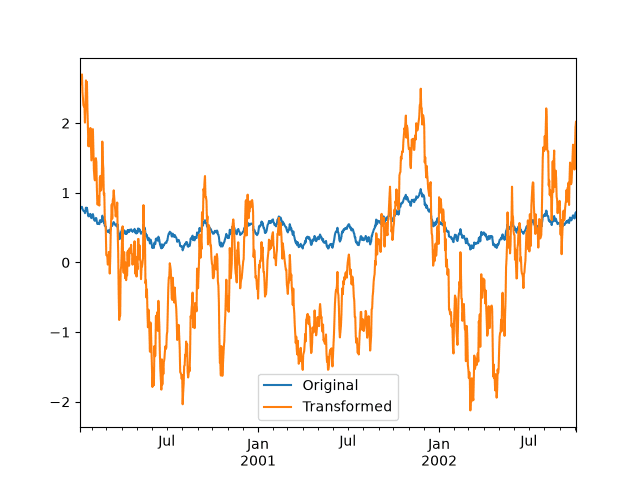
Groupby: The Split-Apply-Combine Strategy
Groupby operations let you split data into groups, apply a function to each, and combine the results. It's how you answer 'what's the average salary per department?' The footgun is using a slow custom .apply() function when a faster built-in method exists.
Scikit-learn's Universal API: Fit, Predict, Transform
The scikit-learn Estimator API is a universal contract: .fit() to learn, .predict() to guess, and .transform() to change data. It's used for everything from StandardScaler to RandomForestClassifier.
Tidy Data: One Variable, One Column
Tidy data is a standard for structuring datasets: each column is a variable, each row an observation. This format simplifies analysis, as tools can expect a consistent input shape.
ggplot2: Building Graphics with a Grammar
ggplot2 treats plots like sentences. You declare components—data, aesthetics (x/y axes, color), and geoms (points, bars)—and it assembles the visual. It's essential for data exploration in R, letting you iterate by swapping layers.