All bites
The whole library, newest first. Filter by what you are here for, or pick a topic if you already know.
8668 bites
Page 201

Compare Kotlin apply and let scope functions
Apply uses this and returns receiver for configuration; let uses it and returns lambda result for null-safe transforms.
When would you use a sealed class instead of an enum?
This tests closed hierarchies versus singleton constants. A strong answer contrasts enums with sealed class instances, shows a NetworkResult example with data-bearing branches, and highlights exhaustiveness.
Explain higher-order functions and implement filterAndTransform
Tests whether you can define higher-order functions and use lambdas idiomatically in Kotlin. A strong answer defines HOFs as functions that take or return functions, then implements filterAndTransform with filter and map.
Explain lateinit var versus val by lazy in Android
Tests deferred initialization and lifecycle coupling. Great answers contrast lateinit var's imperative assignment with lazy's first-access delegation, mapping lateinit to injected Activity fields and lazy to expensive computed objects.

What are the primary advantages of using a data class?
Tests Kotlin boilerplate reduction and value semantics. Name three generated functions like equals, hashCode, and copy; explain structural equality; and show copy updating immutable UI state.
What is an extension function? Write a hasWhitespace extension for String.
Explain receiverType.functionName adds behavior without inheritance; write hasWhitespace with any { it.isWhitespace() }.
Explain val vs var in Kotlin and null safety risks
Val is read-only, var is mutable; nullables use ? like String?; risk is NullPointerException if checks are missed.

Apply AARRR to B2B SaaS vs B2C mobile game analytics
This tests mapping AARRR to instrumentation across business models. A strong answer contrasts B2B account activation and expansion against B2C session-zero funnels and whale monetization. Red flag: same metrics ignoring account hierarchies and ad attribution.
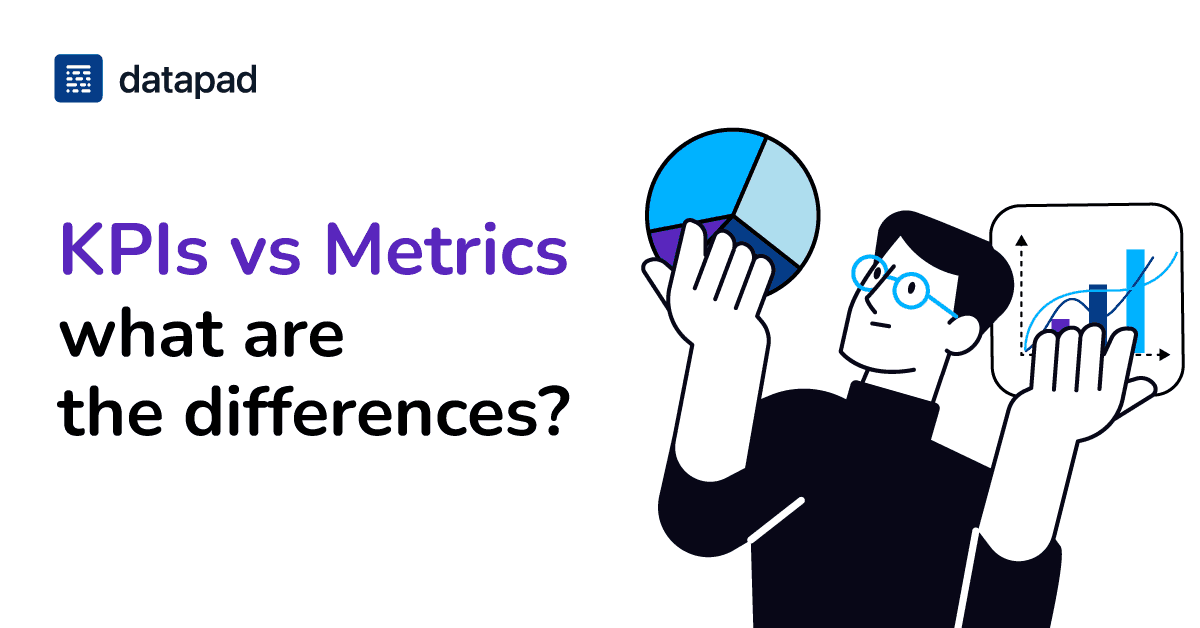
What is the difference between a metric and a KPI?
Tests strategic vs operational measurement discernment. Answer: KPIs track critical goals; metrics track processes. Page views are a metric; conversion rate is the KPI. Red flag: calling all data KPIs or using page views as success proof.
Design column-level data lineage from source to dashboard
Propose AST extractors for Spark and dbt, a graph DB for column edges, and an API for impact analysis.

How do you root-cause a 20% revenue drop with no pipeline failures?
Reconcile against raw events, slice by dimension for silent gaps, audit schema drift.
Design a self-service analytics platform for non-technical users
Tests separation of semantic modeling, UI, and query generation for safe self-service analytics. Strong answers cover a semantic layer with unified metrics, drag-and-drop UI with AST-based SQL generation, and caching.
How would you design an automated data quality monitoring system?
Tests turning data quality into tiered checks for exec dashboards. Strong answers combine freshness, volume, schema, and distribution validation with severity-based paging. Red flag: static thresholds without noise reduction or business-impact triage.

Propose a technical architecture for a centralized Metrics Layer or Metrics Store
This tests your ability to decouple metric semantics from storage and query tools. A strong answer outlines a semantic layer with versioned definitions, a query API, and enforced downstream consumption.
Instrument a mobile event and surface it in analytics
This tests full-stack analytics plumbing. A good answer hits: structured client logging, batched transmission, backend validation, warehouse aggregation, and dashboard verification. A red flag is fire-and-forget logging with no schema checks or reconciliation.
What data do you need and what steps build a WAU dashboard?
Tests defining a metric, modeling events, and wiring them into a BI tool. A strong answer names the feature event, sets a rolling 7-day window, counts distinct users by period, and configures the BI layer. Red flag: jumping to charts before defining active.
Design an A/B test separating novelty from true long-term impact
Tests distinguishing novelty from stable effects. Strong answer: staggered rollout with difference-in-differences comparing early and late adopters over weeks. Red flag: extending the A/B test without modeling time-interaction or control maturation.
Design a real-time mobile analytics pipeline
Tests decoupling high-volume ingestion from low-latency querying. Strong designs use an event broker, a stream processor for windowed aggregates, and an OLAP database for sub-second dashboards.

Design a data model for feature adoption tracking
Tests dimensional modeling for high-volume events so PMs can query Feature A not B without complex SQL. A strong answer uses an event fact table plus a materialized user-feature summary. Red flag: a wide user table with boolean columns per feature.
Explain cohort retention and write a pseudo-query for May signups
Tests cohort retention vs aggregate DAU and SQL self-joins for Week 1, 2, and 4 retention from May signups. Strong answers define cohorts by signup date, use datediff, and left-join activity. Red flag: using calendar week instead of relative signup date.