Cycle Time Scatterplot: Visualize Your Team's Predictability
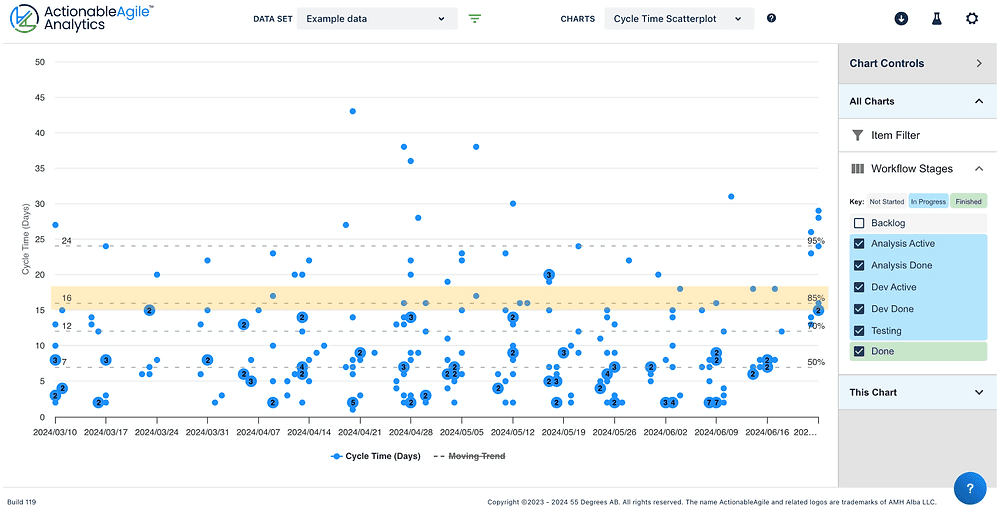
A Cycle Time Scatterplot visualizes delivery speed by plotting how long each task took against its completion date. Agile teams use it to spot predictability trends and set realistic delivery forecasts.
The mental model
A Cycle Time Scatterplot is an X-ray of your team's delivery predictability. Each dot represents a completed work item. Its horizontal position shows when it finished, and its vertical position shows how long it took. This reveals patterns in your workflow's speed and consistency over time.
How it works
The chart has two axes. The horizontal axis (x-axis) is a timeline of completion dates. The vertical axis (y-axis) is the cycle time, which is the total elapsed time from when an item started to when it finished. Every time a task is completed, a dot is placed on the chart at the intersection of its completion date and its total cycle time. A cluster of dots low on the chart indicates fast, consistent delivery.
When to use it
Use this chart to answer key questions about your workflow. First, to find the exact cycle time of any individual piece of work. Second, to assess predictability by observing if the vertical range of dots is shrinking (more predictable) or expanding (less predictable) over time. Third, to create data-driven forecasts for future work based on historical performance. Finally, to establish a Service Level Expectation (SLE) as an internal team goal for delivery times.
When not to use it
This chart is not for understanding the status of work currently in progress, as it only plots completed items. For that, a Cumulative Flow Diagram is more appropriate. It also doesn't inherently explain why cycle times are high; it only shows that they are. It's a diagnostic tool that prompts investigation, not a root cause analysis tool in itself.
One canonical example
An engineering team's scatterplot shows a tight cluster of dots below the 10-day line for the past three months. This tells them they consistently deliver work in 10 days or less. However, they notice a new spray of dots appearing above the 20-day line in the most recent two weeks. This prompts a discussion, revealing a new, complex feature caused the slowdown. They can now use the 10-day mark as their SLE for typical work and be mindful of how complexity impacts their predictability.
Interview question
A team observes a widening vertical spread of dots on their Cycle Time Scatterplot over time. What does this indicate?
- a.The team is consistently delivering work faster than before.
- b.The team has started prioritizing work that is currently in progress.
- c.There has been a significant increase in the total volume of work completed.
- d.The team's delivery times are becoming less predictable.Correct
Why? this is the answer
The card states that an expanding vertical range of dots indicates less predictability in delivery times. It does not inherently reflect changes in average speed, total work volume, or focus on in-progress work.
Just read this? Test yourself on what you have been reading.
Read the original → 55degrees.se
- #agile
- #flow metrics
- #forecasting
- #predictability
- #scrum
You just looked this up. Could you explain it out loud?
That is the part interviews actually test. Tezvyn takes questions like this one and gives you what the interviewer is really checking, the answer that lands, and the mistake that ends the conversation, in the four minutes before your next meeting.
The iPhone app is on the way
We are building it. Until it lands, nothing here is held back from you: every interview card, your saved cards, streaks and the job board all work in Safari, plus hundreds of free practice quizzes of thirty questions each. Sign in and it all carries over to the app the day it arrives.
Want it as an icon? Tap Share at the bottom of Safari, then Add to Home Screen. It opens full screen and the cards you have read stay available offline.
We are hiring for this. Open roles that interview on agile — each one lists the topics its interview covers.
See open roles