Design a real-time top-10 dashboard for a global news site
separating hot-path reads from cold-path analytics at scale.
stream ingestion, windowed aggregation, Redis top-N cache, and TTL eviction.
scanning raw events or running global SQL GROUP BY per request.
What's really being asked
This question tests whether you can distinguish between the hot path, which must serve the dashboard in under 100 milliseconds, and the cold path, which can tolerate seconds of delay. It also tests your understanding of streaming semantics, specifically how to maintain a rolling window without recomputing from scratch, and whether you know that pre-aggregation is mandatory when dealing with millions of events per minute.
The full answer
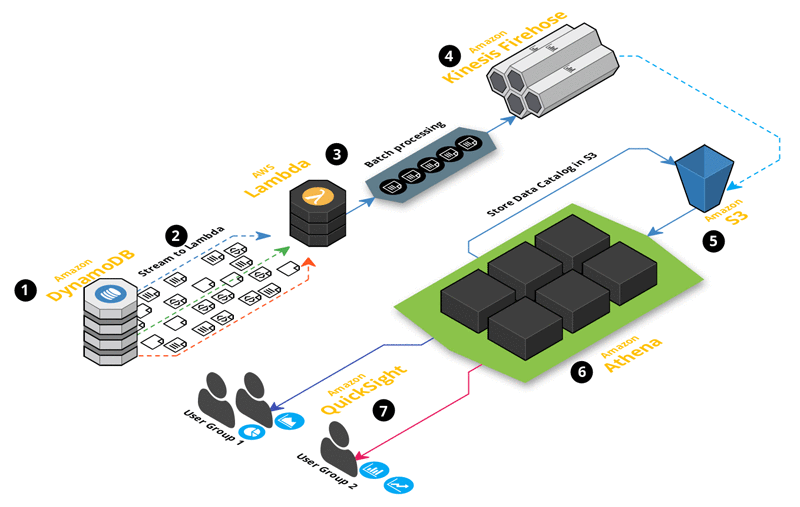
First, an ingestion layer such as Amazon Kinesis that can absorb millions of view events per minute with partition scaling. Second, a stream processing layer using a real-time engine that computes tumbling or sliding window aggregates, for example updating counters every ten seconds over a thirty-minute lookback. Third, a low-latency serving layer, typically an in-memory cache, that stores only the pre-computed top ten list with a TTL of thirty minutes so stale articles expire automatically. Fourth, a cold path that follows the canonical AWS serverless pattern: events are archived to Amazon S3, perhaps via Amazon Kinesis Firehose, for later analysis with Amazon Athena and visualization in Amazon QuickSight, while the live dashboard never queries this layer. Fifth, idempotency and deduplication logic because retries and at-least-once delivery will otherwise inflate view counts.
The mistakes people make
A red flag is suggesting that the web tier query a relational database with a SQL GROUP BY on every page load; this will collapse under viral traffic. Another red flag is storing every raw event in a hot cache and scanning it to compute the top N on read; memory usage grows linearly with traffic and latency becomes unpredictable. A third red flag is confusing the cold path with the hot path by proposing to serve the dashboard directly from Amazon Athena or Amazon QuickSight, as those tools are designed for business analytics rather than sub-second serving.
What usually comes next
The interviewer may ask how you would handle late-arriving events after the window has closed, which touches on watermarking and retraction in stream processors. They may ask what happens if a single article receives ten million views in five minutes, which tests whether your aggregation keys are partitioned well enough to avoid hot shards. They may also ask how to globalize the dashboard, which leads to cross-region replication of the aggregated state or geo-partitioned streams.
A concrete example
Imagine a news article goes viral at 9:00 AM and generates one hundred thousand views per minute. Your Kinesis stream scales to fifty shards, a Flink job with a five-second slide updates article counters in Redis, and the dashboard reads from Redis in under five milliseconds. At 9:31 AM, the TTL evicts the 9:00 AM bucket, so the article drops from the top ten exactly thirty minutes after its peak without any explicit deletion query.
Interview question
Your real-time news dashboard must serve the global top 10 in under 100ms during viral traffic spikes. Which architectural choice correctly implements the hot path?
- a.Ingest views into a scalable stream, have a real-time engine compute sliding-window aggregates, and serve the pre-computed top 10 from an in-memory cache with TTL evictionCorrect
- b.Have the web tier write views to a relational database and execute a SQL GROUP BY article_id ORDER BY count DESC LIMIT 10 on every page load
- c.Archive events to object storage via a delivery stream, run scheduled analytics queries to refresh the top 10, and serve the dashboard from that cached result
- d.Store every raw view event in a hot cache and scan the entire set to compute the top 10 on each dashboard request
Why? this is the answer
Pre-computing windowed aggregates in a stream processor and serving only the top ten from a low-latency cache guarantees sub-100ms reads under millions of events per minute. Option C mistakenly applies the cold-path analytics pattern to live serving, while A and B compute or scan on read, causing latency and memory to spike with traffic.
Just read this? Test yourself on what you have been reading.
Read the original → aws.amazon.com
- #system design
- #streaming
- #real-time analytics
- #redis
- #kafka
You just looked this up. Could you explain it out loud?
That is the part interviews actually test. Tezvyn takes questions like this one and gives you what the interviewer is really checking, the answer that lands, and the mistake that ends the conversation, in the four minutes before your next meeting.
The iPhone app is on the way
We are building it. Until it lands, nothing here is held back from you: every interview card, your saved cards, streaks and the job board all work in Safari, plus hundreds of free practice quizzes of thirty questions each. Sign in and it all carries over to the app the day it arrives.
Want it as an icon? Tap Share at the bottom of Safari, then Add to Home Screen. It opens full screen and the cards you have read stay available offline.
We are hiring for this. Open roles that interview on system design — each one lists the topics its interview covers.
See open roles