Mean or median for API response times?
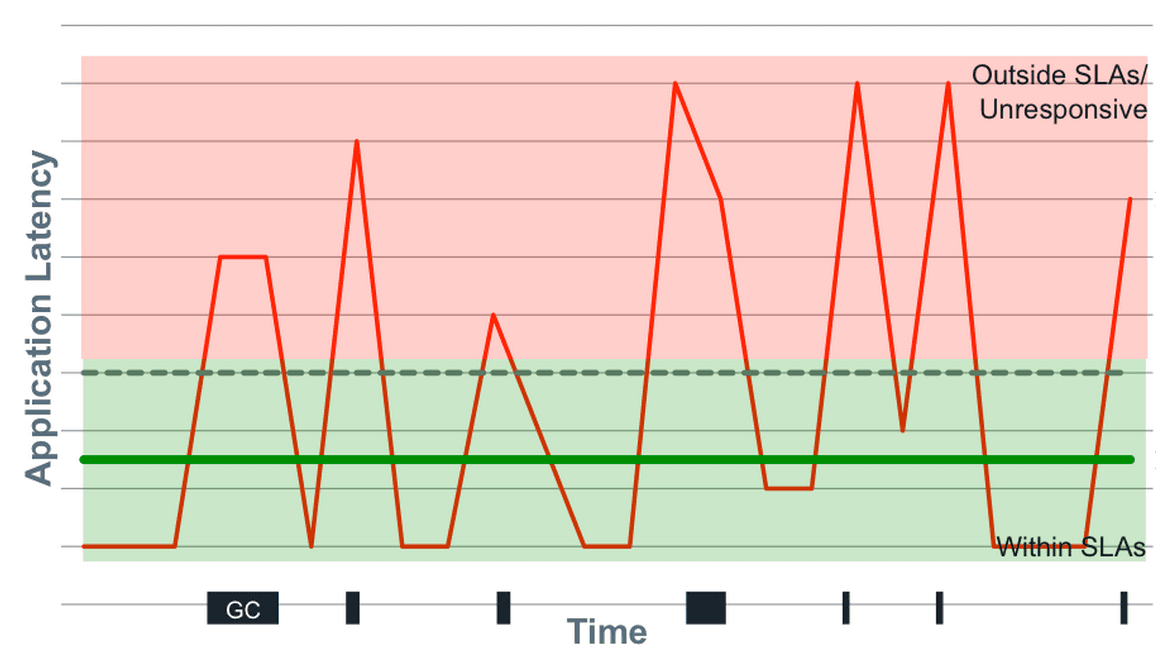
Tests if you know latency is skewed and outlier-sensitive. Pick median over mean because hiccups distort the mean, but note median hides tail latency. Advocate for p95, p99, and max. Red flag: defending mean as representative or ignoring tail behavior.
What's really being asked
Whether you understand that latency distributions are not normal or Gaussian. Interviewers want to see that you recognize API response times are right-skewed, multi-modal, and dominated by hiccups like GC pauses, hypervisor stalls, database reindexing, or cache flushes. They are checking if you know why central tendency alone fails for operational metrics and why tail latency determines real user experience more than typical behavior does.
The full answer
First, state that median is the better central tendency metric because the mean is easily skewed by outliers. A single ten-second GC pause among a thousand fifty-millisecond requests can push the mean from fifty milliseconds to several hundred milliseconds, making it lie about typical performance. Second, immediately qualify that median is still insufficient because it discards the upper half of the distribution entirely and tells you nothing about worst-case behavior. Third, explain that latency is heavily multi-modal due to hiccups, so the only honest way to report it is through percentiles. Fourth, advocate for tracking p95, p99, and especially the maximum, noting that with request fanout users frequently hit tail latencies on every page load. Fifth, mention that averaging percentiles across dimensions or time windows is mathematically invalid and that many dashboards do exactly this.
The mistakes people make
Saying mean is acceptable because it is easy to compute or because your data looks normal. Claiming median alone is good enough for SLAs and user-facing dashboards. Dismissing the maximum as noise rather than signal. Suggesting standard deviation is meaningful for latency. Proposing to average percentiles across hosts or intervals. Saying you only need the ninety-fifth percentile because it captures the common case.
What usually comes next
How many nines matter for your service and why. How request fanout increases the probability of experiencing tail latency. Why averaging percentiles is mathematically absurd. What tooling mistakes you see in dashboards like Grafana. How you would set an SLO based on latency. Whether you would ever use a histogram or heatmap instead of a line graph.
A concrete example
Consider a web page that triggers one hundred API requests. If the median latency is fifty milliseconds but the ninety-ninth percentile is two seconds, the probability that a user experiences at least one two-second request is roughly one minus zero point nine nine to the hundredth power, or about sixty-three percent. Reporting only the median fifty milliseconds would hide the fact that most users actually suffer a visible tail latency. This is why Gil Tene argues that looking only at the common case is a marketing system that dupes engineers and customers into thinking the system is healthy when it is not.
Interview question
Which approach best addresses the limitations of using only median latency for API monitoring?
- a.Add p95, p99, and maximum to capture tail behavior and worst-case performanceCorrect
- b.Average p99 values across hosts to obtain a global tail-latency metric
- c.Use standard deviation around the median to quantify multi-modal variance
- d.Switch to mean latency because it accounts for every request in the dataset
Why? this is the answer
The card advocates tracking p95, p99, and max because median alone discards the upper half of the distribution and hides tail latency. Distractor A is wrong because the mean is easily skewed by outliers like GC pauses, so accounting for every request actually misrepresents typical performance.
Just read this? Test yourself on what you have been reading.
Read the original → bravenewgeek.com
You just looked this up. Could you explain it out loud?
That is the part interviews actually test. Tezvyn takes questions like this one and gives you what the interviewer is really checking, the answer that lands, and the mistake that ends the conversation, in the four minutes before your next meeting.
The iPhone app is on the way
We are building it. Until it lands, nothing here is held back from you: every interview card, your saved cards, streaks and the job board all work in Safari, plus hundreds of free practice quizzes of thirty questions each. Sign in and it all carries over to the app the day it arrives.
Want it as an icon? Tap Share at the bottom of Safari, then Add to Home Screen. It opens full screen and the cards you have read stay available offline.
We are hiring for this. Open roles that interview on latency — each one lists the topics its interview covers.
See open roles