Mean vs. Median for API Response Times?
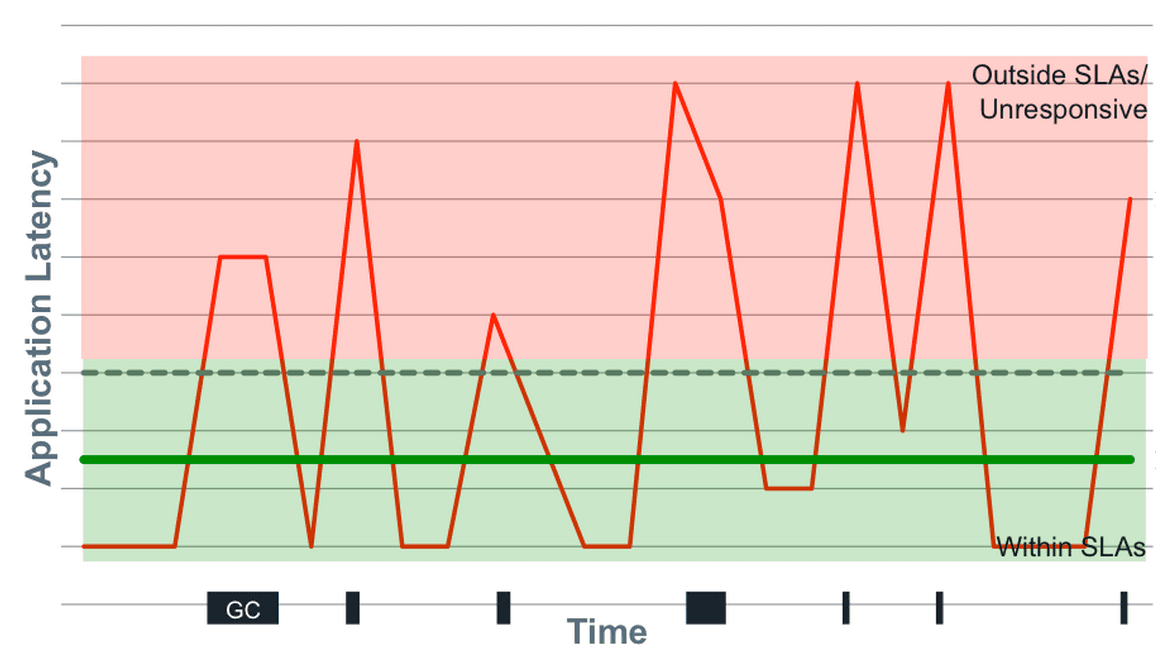
Tests if you know latency data has outliers. A good answer chooses median because it's robust to extremes. Explain that mean gets skewed by a few slow requests (e.g., GC pauses), hiding the typical user experience.
What's really being asked
This question tests your practical understanding of statistics as applied to system performance metrics. Interviewers want to see that you know latency data is not normally distributed—it's often multi-modal with a long tail—and that you can choose the right statistical tool to describe it accurately. It's a check for basic data literacy in an engineering context. You need to show you understand how outliers can distort the perception of system health and hide real user pain.
The full answer
A good answer is definitive and structured. First, state clearly that the median (the 50th percentile) is the correct choice for reporting central tendency. Second, explain WHY: API latency distributions are skewed by outliers caused by things like garbage collection pauses, network hiccups, or database re-indexing. The median is robust to these extreme values, providing a more accurate picture of the typical user's experience. Third, explain the pitfall of the mean: a single, very slow request (e.g., 15 seconds) can drastically pull the average up, making overall performance seem much worse than it is for the majority of users. Fourth, proactively mention that even the median is not enough; to truly understand performance, you must also monitor tail latencies using percentiles like the 99th (p99) and 99.9th (p99.9) to see the worst-case experiences.
The mistakes people make
The most common wrong answer is choosing the mean, which suggests a lack of experience with real-world performance data. Another red flag is saying "it depends" without a strong, specific reason, or treating mean and median as roughly interchangeable. A weak answer might correctly choose the median but fail to articulate why in terms of the data's distribution (skew, outliers). Saying you should discard outliers is a major red flag; as Gil Tene notes, the maximum value is often the most important signal, not noise.
What usually comes next
Expect questions like: "If the median is 100ms, what does that tell you, and what doesn't it tell you?" (Answer: 50% of requests are faster than 100ms; it tells you nothing about the other 50%). Or, "Why not just use p99? Why is median still useful?" (Answer: Median shows the typical case, p99 shows the bad-but-not-catastrophic case. You need both for a complete picture). Another common one is "How would you visualize this data for a non-technical stakeholder?" (Answer: Use a histogram or a cumulative distribution (CDF) plot, not just a single number).
A concrete example
Imagine you have 10 API requests with these response times in milliseconds: 50, 52, 48, 55, 60, 51, 49, 53, 58, and one outlier at 5000 (a 5-second timeout). The median is 54ms (the average of the 5th and 6th values). This accurately reflects the experience of most users. The mean, however, is (50+52+48+55+60+51+49+53+58+5000) / 10 = 547.6ms. Reporting a mean of ~550ms would be highly misleading, suggesting the typical response is 10x slower than it actually is.
Interview question
Which statistical measure best reflects the typical user's experience when analyzing API response times?
- a.The mean, as it provides an average of all recorded response times.
- b.The mode, as it identifies the most common response time observed.
- c.The median, because it is robust to extreme values caused by outliers.Correct
- d.The 99th percentile (p99), to ensure the vast majority of users have a good experience.
Why? this is the answer
The median is preferred because API latency data often contains outliers (e.g., due to GC pauses) that can significantly skew the mean, misrepresenting the typical user experience. While the 99th percentile is crucial for understanding tail latency, it does not represent the 'typical' experience as effectively as the median.
Just read this? Test yourself on what you have been reading.
Read the original → bravenewgeek.com
You just looked this up. Could you explain it out loud?
That is the part interviews actually test. Tezvyn takes questions like this one and gives you what the interviewer is really checking, the answer that lands, and the mistake that ends the conversation, in the four minutes before your next meeting.
The iPhone app is on the way
We are building it. Until it lands, nothing here is held back from you: every interview card, your saved cards, streaks and the job board all work in Safari, plus hundreds of free practice quizzes of thirty questions each. Sign in and it all carries over to the app the day it arrives.
Want it as an icon? Tap Share at the bottom of Safari, then Add to Home Screen. It opens full screen and the cards you have read stay available offline.
We are hiring for this. Open roles that interview on analytics — each one lists the topics its interview covers.
See open roles