Concepts in Data Science & Analytics, page 2

North Star Metric: Aligning Your Team With One Metric
A North Star Metric (NSM) is the single number that best captures the core value your product delivers, acting as a compass for your team. It aligns everyone on a shared goal, like Spotify using 'Time Spent Listening.' The biggest footgun is not having one.

Leading vs. Lagging Indicators: Predict the Future or Report the Past?
Leading indicators are predictive inputs (like sales calls made) that forecast future results. Lagging indicators are outputs (like quarterly revenue) that report what already happened.
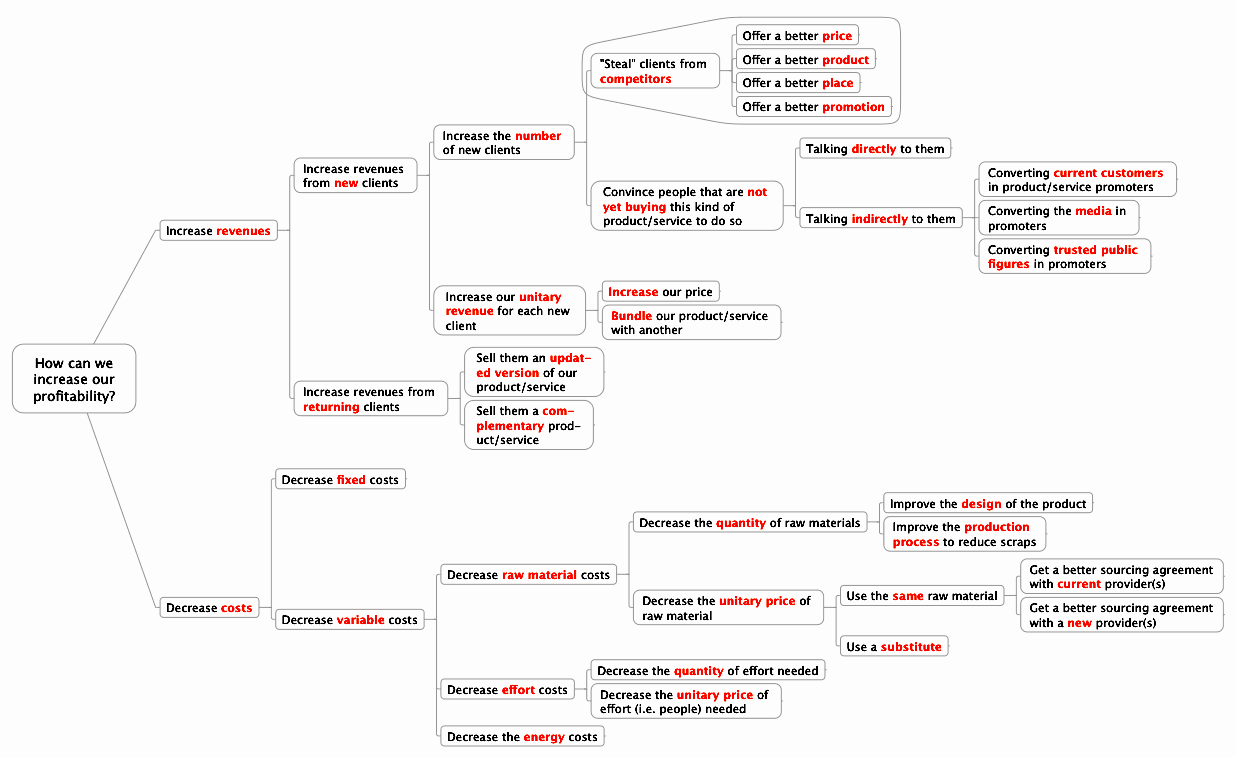
Issue Trees: Deconstruct Problems, Not Symptoms
An issue tree maps a problem's potential root causes. It's used in consulting and debugging to break down vague questions like 'Why is revenue down?' into testable hypotheses.
Causal Inference: Proving Cause, Not Just Correlation
Causal inference goes beyond correlation to ask "did X *cause* Y?". It's used to prove a new feature drove engagement or a drug improved outcomes. The main footgun is mistaking association for causation, ignoring confounding variables.
Uplift Modeling: Who to Target, Not Just Who Will Convert
Uplift modeling finds who to target by predicting the *change* in behavior from an action, not just the final outcome. It's used in marketing to decide who gets a discount, optimizing spend. The footgun is confusing it with a simple conversion model.

Vector Spaces: A Playground for Vectors
A vector space is a collection of vectors with strict rules for how they can be added or stretched. It's the foundation for linear algebra, used in graphics and physics. The footgun: not every set of vectors forms a valid space.
Bayes' Theorem: Updating Beliefs with Evidence
Bayes' Theorem updates your belief in a cause after seeing new evidence. It's used in medical diagnostics to interpret test results and in spam filters. The common footgun is ignoring the base rate—how likely the cause was *before* the evidence appeared.
Linear Regression: Finding the Line of Best Fit
Linear regression draws the 'line of best fit' through your data to predict outcomes. It's used to estimate continuous values, like forecasting sales based on ad spend or predicting a house's price from its size. The main footgun: correlation is not causation.
Hypothesis Testing: A Courtroom for Your Data
Hypothesis testing is a courtroom trial for a claim. You assume 'no effect' (the null hypothesis) and see if your data is strong enough to reject it. The footgun is misreading the p-value: it only measures evidence against the null, not for your alternative.

Matrices: The Language of Linear Transformations
A matrix is a grid of numbers representing a linear transformation, like stretching or rotating space. It's used in graphics to move 3D models and in machine learning to hold data. The footgun: don't just see numbers; see the transformation it encodes.
Eigenvectors and Eigenvalues: The Unchanging Directions of a Transformation
Eigenvectors are the special vectors a transformation only stretches, not rotates; the eigenvalue is the stretch factor. They're the backbone of PCA for dimensionality reduction and Google's PageRank.
Gradient Descent: Finding the Bottom of the Hill
Think of finding the lowest point on a foggy hill by taking steps in the steepest downward direction. It's how machine learning models learn, by iteratively minimizing a cost function. The footgun is the step size: too large overshoots, too small is too slow.
Chain Rule: Unpacking Nested Rates of Change
The chain rule is like Russian nesting dolls for rates of change. To find the derivative of a nested function, you multiply the derivatives of the 'outer' and 'inner' functions. It's the engine behind backpropagation in neural networks.
MLE: Find the Parameters That Make Data Likely
MLE tunes your model until observed data looks inevitable. Use it to fit distributions to logs, traffic, or errors. The footgun: it assumes your distribution family is correct; under a wrong model, it finds the best-fitting wrong answer with high confidence.

SVD: Eigendecomposition for Any Matrix
SVD treats any matrix as rotation, then scaling, then rotation. It generalizes eigendecomposition beyond square normal matrices to any real or complex matrix.
The Jacobian Matrix: A Derivative for Multiple Dimensions
The Jacobian matrix is the multi-dimensional version of a derivative. It's a grid of partial derivatives showing how a small change in each input locally affects each output of a vector function. Don't confuse the matrix with its determinant.
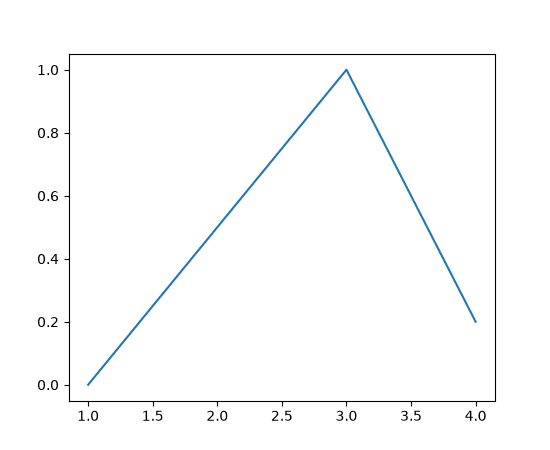
Matplotlib's Object-Oriented API: Explicit Plot Control
Instead of the stateful plt.plot(), Matplotlib's OO API gives you explicit control by creating Figure and Axes objects to call methods on, like ax.plot(). This is crucial for complex plots with multiple subplots. The footgun is mixing styles.
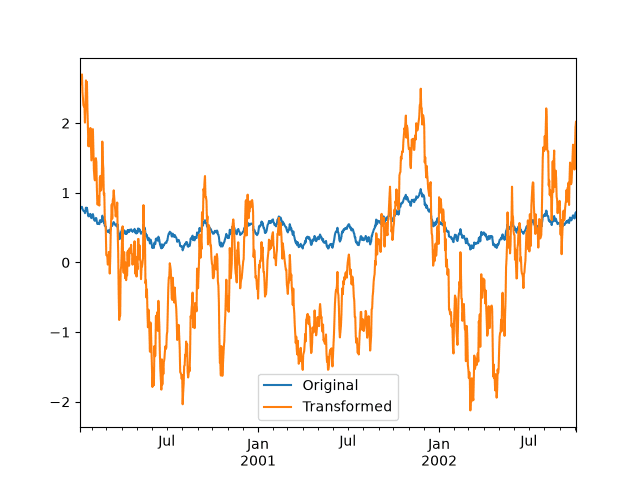
Groupby: The Split-Apply-Combine Strategy
Groupby operations let you split data into groups, apply a function to each, and combine the results. It's how you answer 'what's the average salary per department?' The footgun is using a slow custom .apply() function when a faster built-in method exists.
Scikit-learn's Universal API: Fit, Predict, Transform
The scikit-learn Estimator API is a universal contract: .fit() to learn, .predict() to guess, and .transform() to change data. It's used for everything from StandardScaler to RandomForestClassifier.
Tidy Data: One Variable, One Column
Tidy data is a standard for structuring datasets: each column is a variable, each row an observation. This format simplifies analysis, as tools can expect a consistent input shape.
We are hiring for this. Every open role lists the topics its interview covers, so you can prepare for the real thing rather than guessing.
See open roles