Intermediate interview questions in Data Science & Analytics
How do you define churn for a subscription service?
This tests operationalizing a business metric into a data definition. A strong answer separates voluntary from passive churn, picks a moment, and aligns to the billing cycle. Red flag: counting all cancellations as churn while ignoring grace periods.
How would you recommend launching a checkout flow with mixed A/B metrics?
This tests multi-metric trade-offs. A strong answer tags conversion as success and AOV as a guardrail, estimates net revenue impact, and frames decision as a risk-managed business choice. A red flag is demanding all metrics win or ignoring business context.

How do you frame high-value customer identification as classification versus regression?
Tests mapping a business goal to a defensible target. Outline: define value and action, then contrast regression predicting spend versus classification predicting tiers. Red flag: picking models before fixing the label or the campaign action.
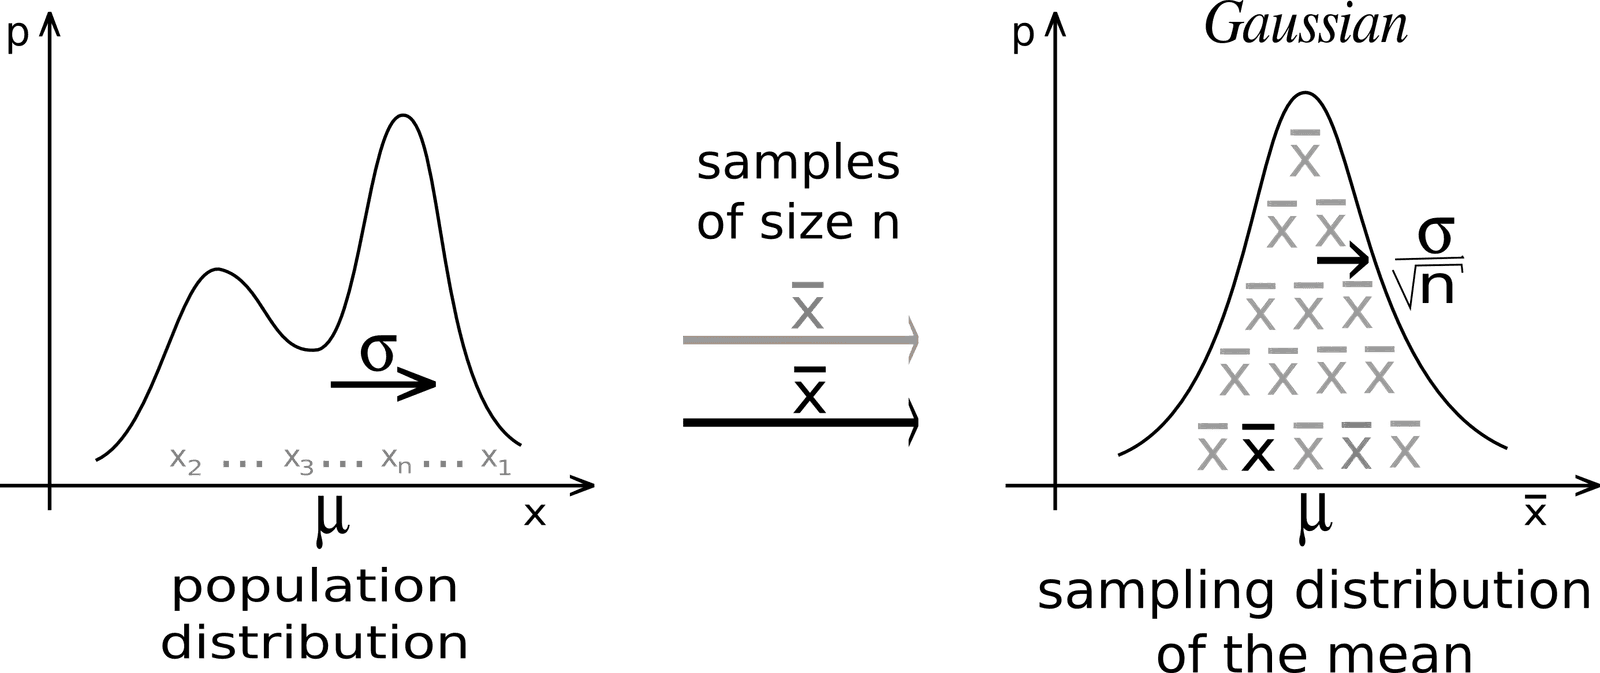
Explain the Central Limit Theorem and its importance for hypothesis testing
This tests whether you know why sample means from skewed populations tend toward normal as size grows, enabling tests. A strong answer covers mean convergence to normal and standard error. Red flag: claiming the CLT works for small samples or single points.

Describe the bias-variance tradeoff and how model complexity affects bias and variance
More complexity cuts bias but boosts variance via overfitting; test error forms a U.

Why is 99% accuracy misleading with 1% disease prevalence?
Tests class imbalance intuition. A strong answer notes that an all-negative classifier hits 99% accuracy, then names precision, recall, F1, and AUC-PR to expose false negatives and false positives. Red flag: claiming accuracy is fine after rebalancing.
How gradient descent and the learning rate work
Gradient descent steps downhill along the negative gradient to minimize cost; the learning rate sets step size; too high diverges or oscillates, too low converges painfully slowly.
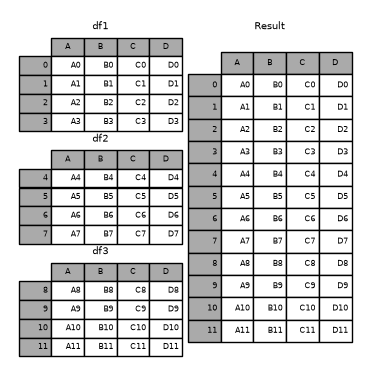
How would you combine customer and transaction DataFrames and describe join types?
This tests relational merging and join semantics in pandas. Answer: use pd.merge on customer_id, then groupby sum; describe inner, left, right, and outer joins by key preservation. Red flag: proposing concat without keys or conflating inner and left joins.
What is vectorization in NumPy and pandas?
Tests if you know why NumPy operations beat Python loops via contiguous memory and C-level SIMD. A strong answer defines vectorization as array-wide operations without explicit loops, contrasts a ufunc to a for-loop, and cites interpreter overhead removal.
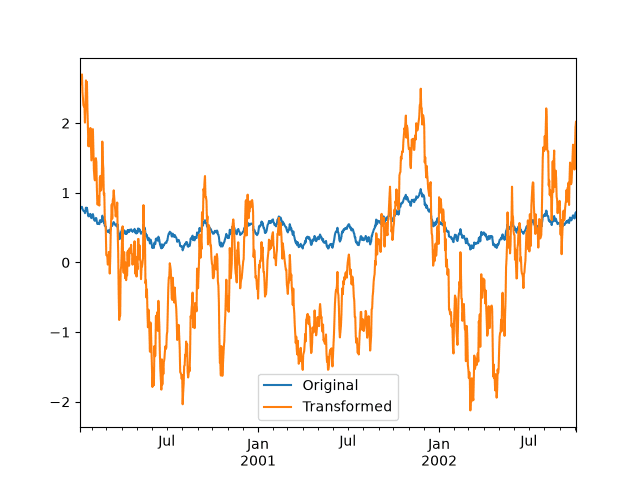
Calculate total and average sales per region in pandas
Tests split-apply-combine fluency. A strong answer groups by Region then calls agg with a dict or named aggregation to return sum and mean of Sales_Amount together. Red flag: chaining separate groupby calls or looping rows manually.
Convert string timestamps to datetime and extract day of week
This tests pandas datetime parsing and accessor fluency. A strong answer uses pd.to_datetime, assigns the result, then extracts the day via .dt.day_name() or .dt.dayofweek. Red flag: manual string splitting or Python loops instead of vectorized ops.

Design a rate-limited REST API data collection script
Tests client-side throttling discipline versus reactive 429 handling. Strong answers proactively pace calls using rate-limit headers, cap concurrency, and apply exponential backoff with jitter. Red flag: tight-loop retries or ignoring headers.
How would you scrape a page with dynamically loaded JavaScript content?
It tests if you know dynamic pages need a real renderer. A great answer names Playwright or Selenium, uses explicit waits for elements, and extracts via DOM or network interception. Red flag: suggesting only static parsers like BeautifulSoup or blind sleeps.

SQL or NoSQL for high-volume semi-structured event ingestion?
Choose NoSQL for schema-less landing; use SQL downstream for structured analytics.
Implement OAuth 2.0 flow to get an access token for API requests
Tests your grasp of OAuth 2.0 grant-type selection and token lifecycle. Strong answers match the script context to client credentials or authorization code flow, detail the token endpoint exchange, and address refresh and expiry.
What is data leakage in preprocessing and cross-validation?
This tests recognition of data leakage through preprocessing statistics. A strong answer defines leakage, describes scaling using global statistics before CV splits, and states transformers must be fit per training fold.
Why is scaling unnecessary for trees but critical for SVM or K-Means?
Tests whether you understand model internals. Trees split on rank order, so scale is irrelevant. SVM and K-Means rely on distance or margin geometry, making magnitude dominate.

What is data pipeline idempotency and how do you design for it?
This tests resilient pipeline design under failure. A strong answer defines idempotency as identical output on repeated runs, highlights safe retries and partial failure recovery, and proposes idempotency keys with atomic writes for daily API loads.
How would you partition a massive user events table?
Tests whether you map query patterns to storage layout to cut bytes scanned. Strong answers pick time-based partitioning for range pruning, cluster by high-cardinality filters, and justify against WHERE clauses.

When is streaming better than batch, and what are its infrastructure challenges?
Tests if you separate low-latency decisions from analytics and know ops pain. Good answer: fraud detection vs batch; cite exactly-once, state recovery, backpressure, schema drift. Red flag: calling streaming faster batch while ignoring backpressure or state.
We are hiring for this. Every open role lists the topics its interview covers, so you can prepare for the real thing rather than guessing.
See open roles