Intermediate concepts in DevOps & Cloud, page 11
Real User Monitoring (RUM): See Your App Through Users' Eyes
Real User Monitoring (RUM) is like a flight recorder for your app, capturing real user clicks, load times, and errors. It's used to measure actual performance and diagnose slowdowns, revealing issues that lab testing misses.
Configuration Drift: When Live State Betrays Git
Configuration drift is when your live system's state no longer matches its Git source of truth. GitOps tools like Argo CD detect this by constantly comparing live resources to Git, flagging any discrepancies.
Apache Airflow: Code-Defined Data Pipelines
Airflow lets you define, schedule, and monitor complex data workflows as code, replacing brittle cron jobs. It's used for ETL jobs or ML training pipelines. The footgun is treating it as a data processing engine; it's an orchestrator, not the worker.
Synthetic Monitoring: Probing Your App Like a Robot User
Synthetic monitoring is like having a robot user click through your app's critical paths 24/7 to catch issues before real users do. It tests key flows like login or checkout, providing a consistent baseline for performance.
Load Balancing Algorithms: How to Pick a Server
Load balancing algorithms are the rules a client uses to pick one server from a pool of identical backends. They're used by web proxies routing user traffic and by microservices calling each other.
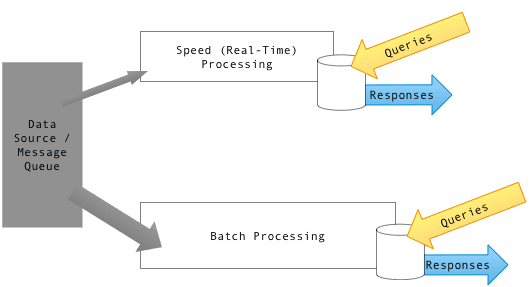
Lambda Architecture: Batch and Stream for Big Data
Lambda Architecture splits data into two paths: a slow, comprehensive batch layer and a fast, real-time stream layer. It's used in big data systems needing both historical accuracy and live views.

DORA Metrics: Vital Signs for Your CI/CD Pipeline
DORA metrics are four vital signs for your software delivery process, balancing speed and stability. They benchmark DevOps performance from commit to production. The main footgun is optimizing for speed while ignoring stability, leading to frequent outages.
DevOps Is Culture, SRE Is Engineering
DevOps is a cultural philosophy for fast, safe delivery; SRE is the engineering discipline that implements it with error budgets and SLOs. They are complementary, not rival job titles. The footgun is hiring SREs and declaring DevOps done.
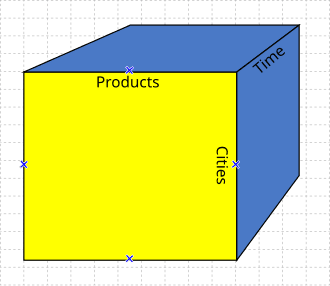
OLAP Cube: Pre-Aggregating Data for Fast Analysis
An OLAP cube is like a Rubik's Cube for your data, pre-calculating answers to complex business questions. It powers BI tools, letting you 'slice and dice' sales data by region and time for fast reports. The footgun: data is typically stale, not real-time.
Pipeline Analytics: Measuring Your CI/CD Health
Pipeline analytics is a fitness tracker for your CI/CD, revealing if builds are getting slower or less reliable. Use it to spot bottlenecks, track failure rates, and compare branches. The footgun is ignoring the P95 duration, which hides worst-case outliers.
Observability vs Monitoring
Monitoring watches predefined metrics and alerts on known failure modes you anticipated. Observability is the property of being able to ask new questions about a system's internal state from its outputs, letting you debug unknown failures you never predicted…
Metrics in Observability
Metrics are numeric measurements aggregated over time, like counters, gauges, and histograms. They are cheap to store and fast to query, making them ideal for dashboards and alerting, but their pre-aggregation discards per-event detail needed for deep…
SLOs Tied to User Journeys, Not APIs
A user-journey SLO measures the full flow a person experiences, not one microservice's health. If checkout is 99.9% up but payments fail, the metric lied. Teams drown in green per-service dashboards while users are furious.
Auto-Instrumentation
Auto-instrumentation automatically adds telemetry to an application without manual code changes, by hooking into libraries, frameworks, or the runtime. It gives broad baseline observability fast, but produces generic spans that often need manual…
Baggage in Distributed Tracing
Baggage is key-value context propagated alongside a trace across service boundaries, so downstream services can read values set upstream. It enables cross-cutting context like tenant id, but it travels in headers on every hop, so overuse adds latency and leak…
Incident Timeline
An incident timeline is a chronological, timestamped record of what happened during an incident: detection, key events, actions taken, and resolution. It anchors the postmortem in facts, separates symptoms from causes, and reveals detection and response…
Flux CD: Git as the Source of Truth for Kubernetes
Flux CD makes Git your cluster's source of truth. It automatically syncs Kubernetes manifests from a repo to your cluster, ensuring the live state matches your config. This is for continuous delivery, not CI.
Runbooks
A runbook is a documented, step-by-step procedure for handling a specific operational task or known failure, such as responding to an alert. It captures expert knowledge so any on-call engineer can act quickly and consistently, reducing reliance on tribal…
The GitOps Reconciliation Loop
Think of it as a thermostat for your infrastructure. A GitOps agent continuously compares your live system's state against the desired state in Git. If it detects drift, it automatically corrects it.
War Room in Incident Response
A war room is a dedicated space, physical or virtual, where responders coordinate during a major incident. It centralizes communication and decision-making under a defined incident commander, cutting confusion and duplicated effort, but should be reserved for…
We are hiring for this. Every open role lists the topics its interview covers, so you can prepare for the real thing rather than guessing.
See open roles