Intermediate concepts in DevOps & Cloud, page 9
The Fan-out Pattern: One Message, Many Receivers
The fan-out pattern uses a single message to trigger multiple parallel actions, like a press conference where one announcement reaches many reporters. Use it for events like a new user signup that triggers emails, analytics, and fraud checks.
Pod Security Context: Set Security Rules for Pods
A Pod Security Context defines security settings for all containers in a Pod, like setting permissions for a user group before adding users. Use it to enforce non-root execution or manage shared volume permissions.
Pod Security Standards: A Security Checklist for Pods
Pod Security Standards are a built-in security checklist for your pods. You apply a level (Restricted, Baseline, Privileged) to a namespace to prevent risky configurations like running as root.
Latency Injection: Testing How Your System Handles Slowdown
Latency injection intentionally slows down parts of your system to test its resilience. Use it to validate timeout configurations and circuit breakers before a real network lag causes a cascading failure. The footgun is injecting unrealistic delays.
Pod Security Admission: Kubernetes' Built-in Guardrails
Think of Pod Security Admission (PSA) as a bouncer for your namespaces, enforcing security rules before pods can run. It applies security standards (Privileged, Baseline, Restricted) via simple labels.
Kubernetes Health Checks: Liveness, Readiness, and Startup Probes
Kubernetes health checks ask your app: "Are you alive?" (liveness), "Ready for traffic?" (readiness), and "Done starting?" (startup). This lets it automate restarts and traffic routing for zero-downtime deployments.
Resource Exhaustion: Starving a System to Death
A resource exhaustion attack is a denial-of-service tactic that starves a system by consuming all of a finite resource like CPU or database connections. It exploits missing rate limits or quotas.
Kubernetes Admission Controllers: The API's Gatekeepers
Think of admission controllers as bouncers for your Kubernetes API. They intercept requests before objects are saved, enforcing custom policies like security rules or required labels. The footgun: a broken controller can block all changes to your cluster.
Traffic Shaping for Safer Deployments
In deployments, traffic shaping isn't about network speed, but controlling user exposure. You route a precise percentage of users to a new code version, slowly 'opening the valve' from 1% to 100% to de-risk the release. This is the engine of a canary deploy.
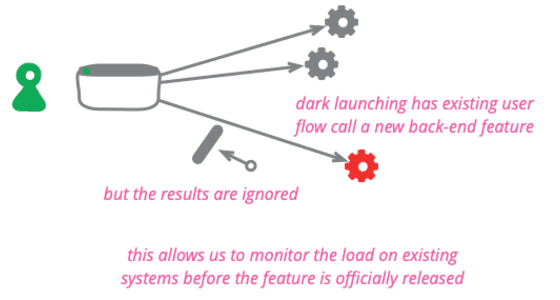
Dark Launch: Test New Code Invisibly in Production
A dark launch tests new backend code on real production traffic without any user ever seeing it. Use it to measure the performance impact of a new recommendation engine or data service before the UI is built.
Chaos Mesh: Orchestrated Failure for Resilient Systems
Chaos Mesh is a disaster-as-a-service for Kubernetes. It lets you inject failures like network latency or pod kills to test system resilience. Use it to find weaknesses before they impact users, but be warned: its job is to break things, so scope experiments…
SLIs & SLOs: Measuring What Matters for Service Reliability
SLIs are what you measure (e.g., latency); SLOs are the target you aim for (e.g., 99% success). They replace vague feelings about service health with concrete numbers. This is how SREs define and manage reliability.

Shadow Deployment: Rehearsing a Release with Live Traffic
Shadow deployment is like a stunt double for your service: it receives a copy of live production traffic to test a new version without impacting users. Use it to validate performance and find bugs under real load.
AWS Fault Injection Simulator
AWS Fault Injection Simulator is a controlled chaos button: it breaks resources on purpose to prove your failover works before real disasters. Run it before peak traffic to validate auto-healing.
Cloud Cost Management: Taming Your Bill
Treat cloud spend like a utility bill you can actively control, not a fixed cost. It's essential when your AWS, GCP, or Azure bill is growing unpredictably. The biggest footgun is treating cost management as a one-time cleanup instead of a continuous process.

Deployment Rings: De-risking Rollouts with Progressive Exposure
Deployment rings are like blast shields for software updates, containing a bad release's impact to a small group. They're used in CI/CD to roll out changes progressively, from internal teams to all users.
Kubernetes Metrics Server: The Engine for Autoscaling
Metrics Server is the dedicated speedometer for your cluster's pods, feeding CPU and memory usage to Kubernetes's autoscalers. It powers the Horizontal and Vertical Pod Autoscalers and the kubectl top command. The footgun: it's *only* for autoscaling.
Kubernetes Cluster-Level Logging
Cluster-level logging treats logs as a stream, not as files on ephemeral pods. It centralizes logs from all nodes before they disappear when a pod dies, which is essential for debugging any production application.
SRE Team Topologies: Organizing for Fast Flow
Team Topologies structure teams to speed up value delivery by organizing around the software itself. This model helps scale product organizations, adopt cloud-native architectures, or build a platform engineering function.

Prometheus Architecture: A Pull-Based Monitoring System
Prometheus is a monitoring system that actively pulls metrics from your services, rather than waiting for them to push data. It's the standard for tracking performance in dynamic environments like Kubernetes.
We are hiring for this. Every open role lists the topics its interview covers, so you can prepare for the real thing rather than guessing.
See open roles