Advanced everything in Product Management, page 7

How would you implement a software Andon Cord equivalent?
This tests translating Lean stop-the-line into CI/CD culture. Trigger: compile, test, or integration failures. Impact: halt pipeline, block merges, and swarm to fix immediately with collective ownership. Red flag: blaming committers or deferring fixes.
Design a Column-Level Data Lineage System at Scale
Tests your ability to design a metadata system with three distinct components. A strong answer outlines collection (e.g., OpenLineage), storage in a graph database (e.g., Neo4j), and visualization for impact analysis.

A key metric dropped 20%. How would you investigate?
This tests systematic diagnosis of critical issues. A great answer segments the drop (by region, platform), then traces data upstream from the dashboard to the source, correlating with technical metrics. A red flag is jumping to code before scoping the impact.
Design an experiment to isolate long-term impact from novelty effect
Tests if you can design experiments for long-term impact, not just short-term lift. A good answer involves a long-running test, segmenting users by tenure, and modeling the effect over time to find its stable asymptote.
Design a Real-Time Analytics Pipeline for Mobile Events
This tests your grasp of low-latency streaming architectures. A good answer outlines ingestion (SDK to Kafka/Kinesis), real-time processing (Flink/Spark), and sinking to a fast OLAP database (Druid/ClickHouse). A red flag is proposing a batch-based ETL design.

Design a Near Real-Time Analytics Pipeline
Tests your ability to design a low-latency data system and articulate trade-offs. A good answer covers ingestion (Kafka), processing (Flink), storage (Druid), and visualization (Grafana), contrasting the architecture's low latency with a batch setup.
Optimizing a Slow, Expensive Data Warehouse for BI Dashboards
Tests your grasp of data warehouse architecture beyond basic SQL. A great answer covers partitioning/clustering, materialized views for pre-aggregation, and cost controls. A red flag is suggesting only query rewrites or just 'adding more compute'.

Correlate API Slowness with User Engagement
This tests your ability to design a controlled experiment and join disparate data. A good answer outlines an A/B test with an artificial delay, logging with shared IDs, and statistical analysis. A red flag is proposing a purely observational study.
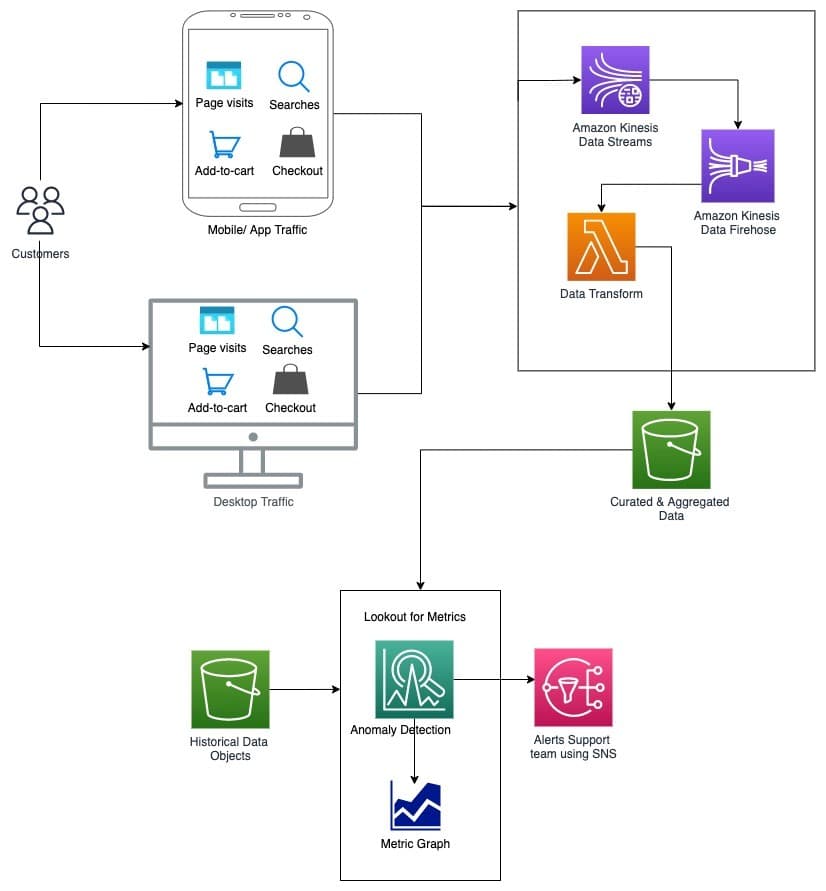
Design a Real-Time Anomaly Detection System for E-commerce Events
This tests your ability to design a real-time data pipeline and apply ML to a business problem. Outline a streaming architecture (e.g., Kinesis), processing, and storage.

Describe two methods for generating prediction intervals
This tests your grasp of uncertainty quantification. A great answer contrasts an analytical method (assuming normal errors, using multipliers like 1.96 for 95%) with a simulation method (bootstrapping residuals).
How do you diagnose and fix a model's degrading performance?
Tests your MLOps process for handling model decay. Name it "concept drift," then outline a plan: diagnose by comparing data distributions, solve with a targeted retraining strategy, and implement proactive monitoring. A red flag is just saying "retrain it."

How CUPED increases statistical power in experiments
Tests your grasp of variance reduction in A/B testing. Explain how CUPED uses correlated pre-experiment data to reduce outcome variance, increasing statistical power. A red flag is confusing it with simpler difference scores, which can actually increase noise.
Why is user-level randomization flawed by spillover effects?
Tests your grasp of SUTVA violations in network experiments. Explain how spillover contaminates the control group, then propose graph cluster randomization—grouping users and assigning entire clusters to A/B variants—to minimize interference.
Why can't we t-test p99 latency in an A/B test?
This tests if you know why t-tests fail for percentiles. A t-test requires a normally distributed statistic (like the mean), but a sample p99's distribution isn't normal.

Design a Fast, Multi-Dimensional Analytics Dashboard
This tests your grasp of data warehousing trade-offs for analytics. A great answer compares OLAP cubes (fast, pre-computed) vs. columnar DBs (flexible, real-time), then proposes a hybrid model.
How would you validate a feature's success, correcting for self-selection?
This tests your ability to separate correlation from causation. A great answer identifies self-selection bias, proposes a quasi-experimental method like Propensity Score Matching to create a control group, and then compares outcomes.
How would you visually represent statistical uncertainty in a chart?
This tests your ability to accurately communicate statistical significance. A great answer discusses error bars (with 95% CIs), then more advanced options like gradient or violin plots, and frames the choice by audience.
Strategy for Visualizing Millions of Time-Series Points
Tests your strategy for balancing performance and visual fidelity with large datasets. Propose backend downsampling with an algorithm like LTTB to preserve peaks, then discuss multi-resolution data fetching on the frontend.

How do you manage schema evolution in an analytics pipeline?
This tests your grasp of data as a contract. A great answer covers schema registries, backward compatibility, and a phased rollout from producer to warehouse. A red flag is only mentioning an ALTER TABLE command, ignoring the entire data pipeline.
Challenges of Grouping by High-Cardinality Dimensions
This tests your grasp of system-level impacts of data shape. A good answer explains how high cardinality strains memory during aggregation, reduces compression, and inflates index size, leading to slow, expensive queries. A red flag is just saying 'it's slow'.
We are hiring for this. Every open role lists the topics its interview covers, so you can prepare for the real thing rather than guessing.
See open roles