All bites
The whole library, newest first. Filter by what you are here for, or pick a topic if you already know.
4247 bites
Page 160
Pair Programming Drives Design System Adoption
Pair programming with the system team embeds design system knowledge directly into product code. Use it when a squad ships their first feature with new tokens or components. The footgun is treating the session as code review rather than knowledge transfer.
NPS for Design Systems: Smoke Alarm, Not Scorecard
NPS for design systems is a smoke alarm for team trust, not a feature scorecard. Poll consuming teams quarterly to catch sentiment drops before adoption stalls. Never benchmark against consumer SaaS; internal tools face forced usage and different expectations.
Quantify UI Debt Before It Compounds
UI debt quantification turns messy interfaces into measurable cost. Teams track component adoption, override rates, and design-dev drift to prioritize refactors. The footgun is treating every inconsistency as debt, ignoring the business value of shipping fast.
Component Stability Index
A component stability index is a maturity signal that tells consumers how safe a design-system component is to use, from experimental to stable to deprecated, setting expectations about API churn and supporting confident adoption decisions.
Migration Guide: Operational Playbook for Design System Changes
A migration guide is an operational playbook, not just docs: it phases breaking design system changes across production code so teams don't freeze development. Skip the operational plan and you end up with a permanent dual-system mess.
Automated Deprecation Warnings in Design Systems
Deprecation warnings are a design system's immune system: they flag outdated components in an editor before bad code ships. They matter most when dozens of teams consume the system. The footgun is warning fatigue; silenced errors hide real breaking changes.
Design System API Review
A design system API review treats component props as a public contract before code ships. It catches inconsistent naming, prop bloat, and breaking changes that fragment the product. Teams skip it because "it is just UI," creating unmaintainable interfaces.
Token Aliasing: Theme by Role, Not Value
Token aliasing names a color by its job, not its hex, so you swap the underlying value per theme. One library supports light mode, dark mode, or multiple brands without code changes. The footgun is deep alias chains that hide which primitive value renders.
Scoped Theming: Local Overrides Without Global Leaks
Scoped theming is sunglasses for a UI subtree: it swaps tokens for one section without touching the global page. Use it for a dark-mode dashboard or white-label widget inside a light app, but avoid deep nesting or you will fight invisible inheritance chains.
Structural vs. Thematic Tokens: Job vs. Value
Structural tokens describe the role, like text-primary; thematic tokens describe the value, like blue-500. Split them so retheming does not require hunting hexes. The footgun is using only thematic tokens, which hardcodes intent and breaks dark mode.
Material Design: Android's Paper Metaphor
Material Design models Android UI as stacked paper with light and elevation. It ships pre-built components like cards and FABs so your app feels native immediately.
Map Components to Native Platform Equivalents
Map design system components to native OS equivalents instead of forcing identical custom widgets everywhere. Use this when cross-platform apps must respect platform conventions.
Stakeholder Analysis: Mapping Influence and Interest
Stakeholder analysis maps your project's human landscape, plotting who is affected (interest) and who can affect its outcome (influence). It's used to anticipate needs and align on goals.
5 Whys: Find the Root Cause, Not the Symptom
The 5 Whys technique finds a problem's root cause by repeatedly asking "Why?" to trace a cause-and-effect chain. Use it in post-mortems to understand system failures. The footgun is blaming people instead of asking why the process allowed the error.
The MECE Principle: No Overlaps, No Gaps
The MECE principle structures analysis with 'no overlaps, no gaps.' Use it to break down problems, segment users, or plan projects. The footgun is achieving one rule (exclusive categories) but not the other (covering all cases), leading to flawed conclusions.
Hypothesis-Driven Analysis: Ask First, Analyze Second
Start with a specific question, then use data to find a clear yes/no answer. This approach is perfect for A/B testing or diagnosing metric changes, but watch out for confirmation bias—seeking data that only proves your initial belief.

North Star Metric: Aligning Your Team With One Metric
A North Star Metric (NSM) is the single number that best captures the core value your product delivers, acting as a compass for your team. It aligns everyone on a shared goal, like Spotify using 'Time Spent Listening.' The biggest footgun is not having one.

Leading vs. Lagging Indicators: Predict the Future or Report the Past?
Leading indicators are predictive inputs (like sales calls made) that forecast future results. Lagging indicators are outputs (like quarterly revenue) that report what already happened.
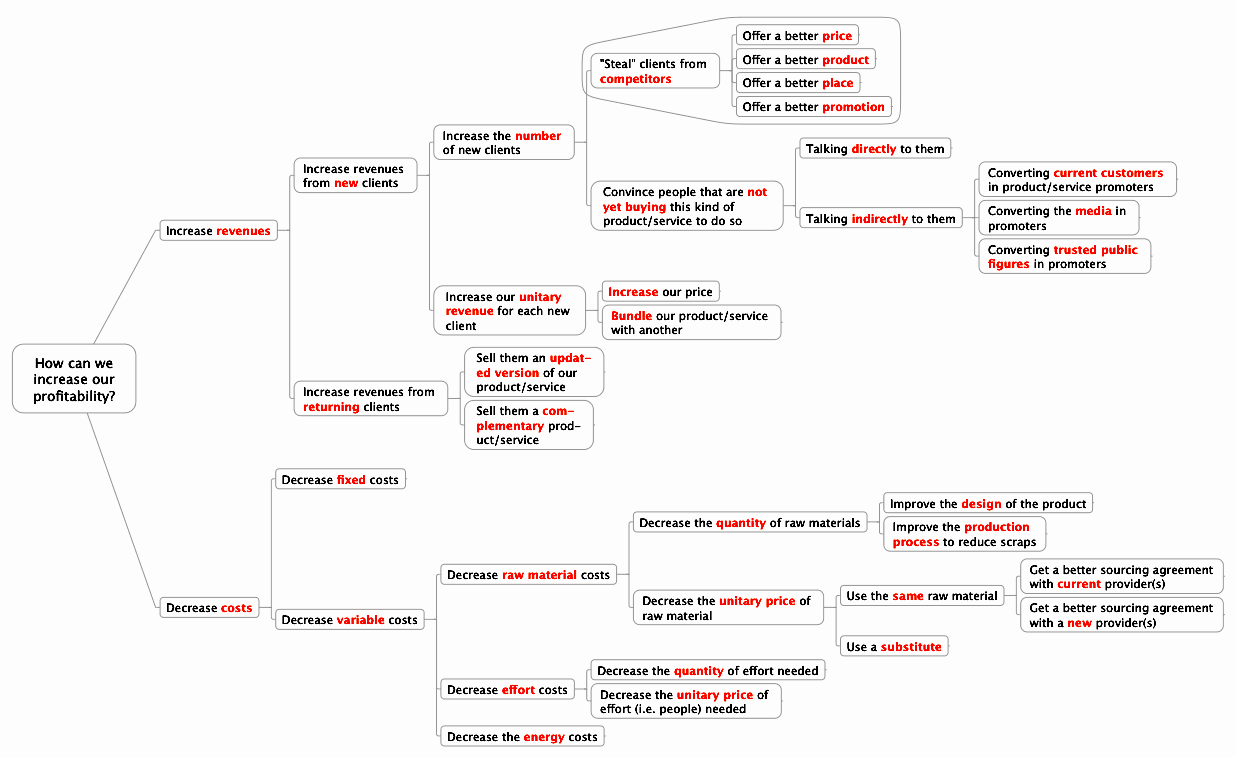
Issue Trees: Deconstruct Problems, Not Symptoms
An issue tree maps a problem's potential root causes. It's used in consulting and debugging to break down vague questions like 'Why is revenue down?' into testable hypotheses.
Causal Inference: Proving Cause, Not Just Correlation
Causal inference goes beyond correlation to ask "did X *cause* Y?". It's used to prove a new feature drove engagement or a drug improved outcomes. The main footgun is mistaking association for causation, ignoring confounding variables.