All bites
The whole library, newest first. Filter by what you are here for, or pick a topic if you already know.
4330 bites
Page 120
How would you measure P95 latency by geographic region?
Tests your ability to translate a business need into a concrete observability implementation. A good answer involves instrumenting the API with a histogram metric, adding a region label via GeoIP, and querying with histogram_quantile.
How would you measure P95 latency by geographic region?
Tests your ability to design a practical metrics pipeline, considering instrumentation, data types (metrics vs. logs), and aggregation. Instrument the API with a histogram metric and a region label, then query using histogram_quantile.
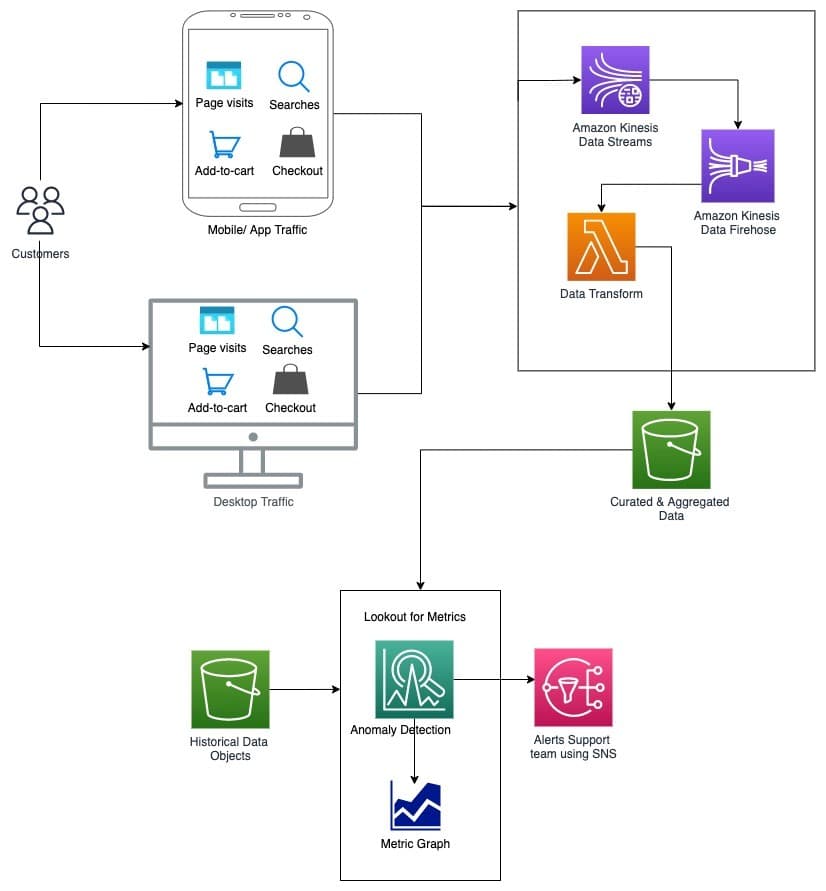
Design a system to detect sudden add-to-cart drops in real time
This tests streaming pipeline design and seasonality-aware anomaly detection. Outline Kafka or Kinesis ingestion, windowed aggregations, and ML baselines tuned to hourly and weekly trends. Red flag: static thresholds that ignore daily patterns.
Design a Real-Time Anomaly Detection System for E-commerce Events
This tests your ability to design a real-time data pipeline and apply ML to a business problem. Outline a streaming architecture (e.g., Kinesis), processing, and storage.
Design a real-time anomaly detection system for 'add to cart' events
Tests real-time data pipeline design and nuanced anomaly detection. A good answer outlines ingestion (Kinesis), processing (Lambda/Flink), seasonal modeling for 'a drop', and alerting (SNS).

Design an experiment and logging to link API latency to engagement
Causal inference and data integration. Randomly inject latency for a treatment group with a control at baseline, then join server trace IDs to client events via a shared request ID. Never confuse correlation with causation or miss join issues.
Correlate API Slowness with User Engagement
This tests your ability to design a controlled experiment and join disparate data. A good answer outlines an A/B test with an artificial delay, logging with shared IDs, and statistical analysis. A red flag is proposing a purely observational study.
Prove API Latency Affects User Engagement
This tests your ability to design a controlled experiment for a backend attribute. A great answer outlines an A/B test that artificially adds latency for a treatment group, details the necessary logging with shared IDs, and explains how to join and analyze…

Describe tracking a user event end-to-end from frontend to BI tool
Mention frontend instrumentation, routing, ingestion, warehouse transforms, and BI querying.
Describe tracking a user event from frontend to BI tool
Tests your grasp of the modern data stack. A great answer outlines the five stages: frontend emission, ingestion, loading into a warehouse, transformation, and BI visualization. A red flag is describing only the frontend code and ignoring the data pipeline.
Track a user event from frontend code to a BI tool
Tests your understanding of the modern data stack. A good answer traces the event from frontend capture, through an ingestion pipeline, into a data warehouse, and finally to a BI tool for analysis. A red flag is describing only one part of the journey.

Describe dbt's role and how it differs from traditional ETL
Position dbt as ELT's T with lineage, tests, docs; contrast with Python ETL using external compute and Airflow only scheduling tasks.
Describe the role of dbt in a modern analytics stack
Tests your grasp of modern ELT patterns. A good answer explains how dbt uses SQL for in-warehouse transformations, enabling software engineering practices like version control and testing. A red flag is confusing dbt with a full ETL tool or an orchestrator.
Describe dbt's role in a modern analytics stack
Tests your grasp of the ELT paradigm and applying software engineering principles to data. A good answer defines dbt as the 'T' in ELT, contrasts its in-warehouse SQL approach with traditional ETL, and clarifies its relationship with orchestrators like…
Designing a warehouse model for feature adoption
Star schema with a feature-usage fact table at a defined grain, surrounded by user, feature, date, and device dimensions.
Design a Data Model for a Feature Adoption Dashboard
This tests your ability to translate a business need into a scalable star schema. A great answer defines a central fact table (e.g., fct_feature_usage) and its dimensions (dim_users, dim_features, dim_date).
How would you design a data model for a feature adoption dashboard?
Tests applying dimensional modeling to a business need. A good answer defines a central fact table (e.g., feature_usage) and related dimensions (user, feature, date). A red flag is designing a transactional model or being too vague about the schema.
Explain event schemas and why schema registries matter at scale
This tests schema evolution and data contracts in distributed systems. A good answer defines schemas as contracts, explains that a registry enforces compatibility to block breaks, and lists pain like pipeline failures. Never treat schemas as optional docs.
Explain event schemas and the purpose of a schema registry
Tests your grasp of data contracts at scale. A good answer defines schemas as contracts, a registry as the enforcer of compatibility (e.g., backward/forward), and explains how this prevents 'poison pill' messages and brittle analytics.
Explain event schemas and the purpose of a schema registry
This tests your grasp of data governance in event-driven systems. A good answer defines a schema as a contract, a registry as the enforcer, and then details specific downstream failures like broken pipelines and bad analytics. A red flag is being too vague.