All bites
The whole library, newest first. Filter by what you are here for, or pick a topic if you already know.
8668 bites
Page 215
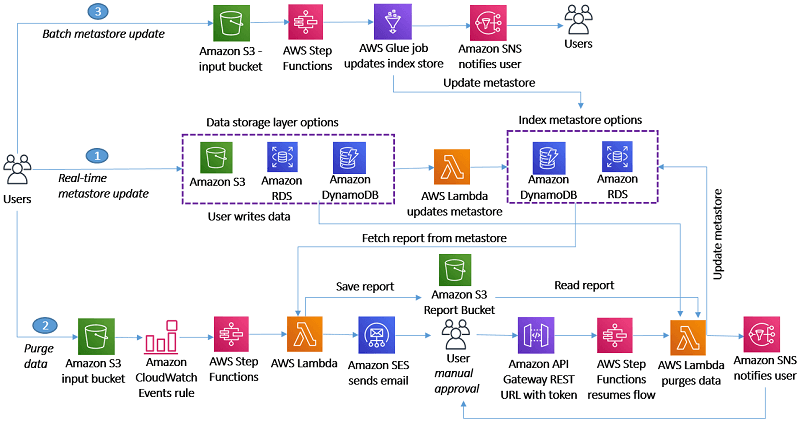
Enforce GDPR's Right to be Forgotten Across a Complex Architecture
This tests your design of a verifiable, async deletion workflow. A strong answer proposes a central index metastore, an orchestrated workflow (e.g., Step Functions) for deletion, and an auditing layer.
How would you design a 'button_click' analytics event payload?
This tests your ability to design for future analysis. A great answer specifies core identifiers (user ID, timestamp), contextual properties (page, component), and a flat JSON structure. A red flag is forgetting the user ID or providing an unstructured list.

Apply the AARRR framework to B2B SaaS vs. B2C mobile games
Tests translating the AARRR framework into concrete analytics for different business models. Define AARRR, then contrast B2B SaaS (account-level activation) with B2C games (user-level engagement). Red flag: using identical metric definitions for both contexts.

What is the difference between a metric and a KPI?
This tests your ability to connect technical measures to business outcomes. Define metrics as operational data and KPIs as the subset tied to critical goals.
Design a Column-Level Data Lineage System at Scale
Tests your ability to design a metadata system with three distinct components. A strong answer outlines collection (e.g., OpenLineage), storage in a graph database (e.g., Neo4j), and visualization for impact analysis.

A key metric dropped 20%. How would you investigate?
This tests systematic diagnosis of critical issues. A great answer segments the drop (by region, platform), then traces data upstream from the dashboard to the source, correlating with technical metrics. A red flag is jumping to code before scoping the impact.
Design a self-service analytics platform for non-technical users
Tests your ability to abstract SQL. A great answer outlines a semantic layer for virtual datasets, a no-code drag-and-drop UI, and a backend that translates UI state into SQL queries. A red flag is describing only a SQL editor, ignoring non-technical users.

Design an A/B Testing Framework
This tests your ability to design a scalable system with statistical rigor for non-experts. A great answer outlines config management, deterministic user hashing, a data pipeline for metrics, and a results UI that simplifies stats.
How would you design a data quality monitoring system?
This tests your systematic approach to data reliability. A strong answer defines quality dimensions (freshness, volume, schema), proposes specific checks, and outlines an alerting strategy. A red flag is listing checks without tying them to business impact.

Propose a technical architecture for a centralized Metrics Layer.
This tests your grasp of data governance and semantic layers. A great answer outlines a system with a central definition store (e.g., YAML in Git), a query engine, and an API, ensuring all teams get consistent metric results.
Instrumenting a New User Interaction in a Mobile App
Tests your understanding of the end-to-end analytics pipeline. A good answer defines the event, instruments it on the client with an SDK, verifies it in a debug view, and confirms its arrival in the data warehouse after the ETL process.
How would you build a weekly active user dashboard?
This tests translating a business need into a technical spec. First, clarify the definition of "active." Then, identify the event data needed (user_id, timestamp). Finally, outline the ETL and BI tool steps. A red flag is not clarifying the metric first.
Design an experiment to isolate long-term impact from novelty effect
Tests if you can design experiments for long-term impact, not just short-term lift. A good answer involves a long-running test, segmenting users by tenure, and modeling the effect over time to find its stable asymptote.
Design a Real-Time Analytics Pipeline for Mobile Events
This tests your grasp of low-latency streaming architectures. A good answer outlines ingestion (SDK to Kafka/Kinesis), real-time processing (Flink/Spark), and sinking to a fast OLAP database (Druid/ClickHouse). A red flag is proposing a batch-based ETL design.

Design a data model for tracking feature adoption
This tests your grasp of data warehouse star schemas for analytics. Outline a fact table for events and dimension tables for users and features, explaining how this structure enables fast, ad-hoc cohort analysis for a product manager.

Explain cohort analysis and write a retention query
Tests your grasp of user behavior metrics. First, define a cohort (e.g., May signups). Then, explain why it's better than aggregate retention. Finally, outline a query grouping users by signup week and checking for activity. A red flag is a flawed query.

Track an 'Export to CSV' button's usage
This tests modeling a feature's full lifecycle (intent, success, failure) in analytics. Propose one custom event like export_interaction with a status parameter ('success', 'failure') fired on completion, not just on click.

Design a Near Real-Time Analytics Pipeline
Tests your ability to design a low-latency data system and articulate trade-offs. A good answer covers ingestion (Kafka), processing (Flink), storage (Druid), and visualization (Grafana), contrasting the architecture's low latency with a batch setup.
Optimizing a Slow, Expensive Data Warehouse for BI Dashboards
Tests your grasp of data warehouse architecture beyond basic SQL. A great answer covers partitioning/clustering, materialized views for pre-aggregation, and cost controls. A red flag is suggesting only query rewrites or just 'adding more compute'.
Explain event schemas and the purpose of a schema registry
Tests your grasp of data contracts at scale. A good answer defines schemas as contracts, a registry as the enforcer of compatibility (e.g., backward/forward), and explains how this prevents 'poison pill' messages and brittle analytics.