All bites
The whole library, newest first. Filter by what you are here for, or pick a topic if you already know.
8668 bites
Page 216
Design a Data Model for a Feature Adoption Dashboard
This tests your ability to translate a business need into a scalable star schema. A great answer defines a central fact table (e.g., fct_feature_usage) and its dimensions (dim_users, dim_features, dim_date).

Describe the role of dbt in a modern analytics stack
Tests your grasp of modern ELT patterns. A good answer explains how dbt uses SQL for in-warehouse transformations, enabling software engineering practices like version control and testing. A red flag is confusing dbt with a full ETL tool or an orchestrator.

Describe tracking a user event from frontend to BI tool
Tests your grasp of the modern data stack. A great answer outlines the five stages: frontend emission, ingestion, loading into a warehouse, transformation, and BI visualization. A red flag is describing only the frontend code and ignoring the data pipeline.

Correlate API Slowness with User Engagement
This tests your ability to design a controlled experiment and join disparate data. A good answer outlines an A/B test with an artificial delay, logging with shared IDs, and statistical analysis. A red flag is proposing a purely observational study.
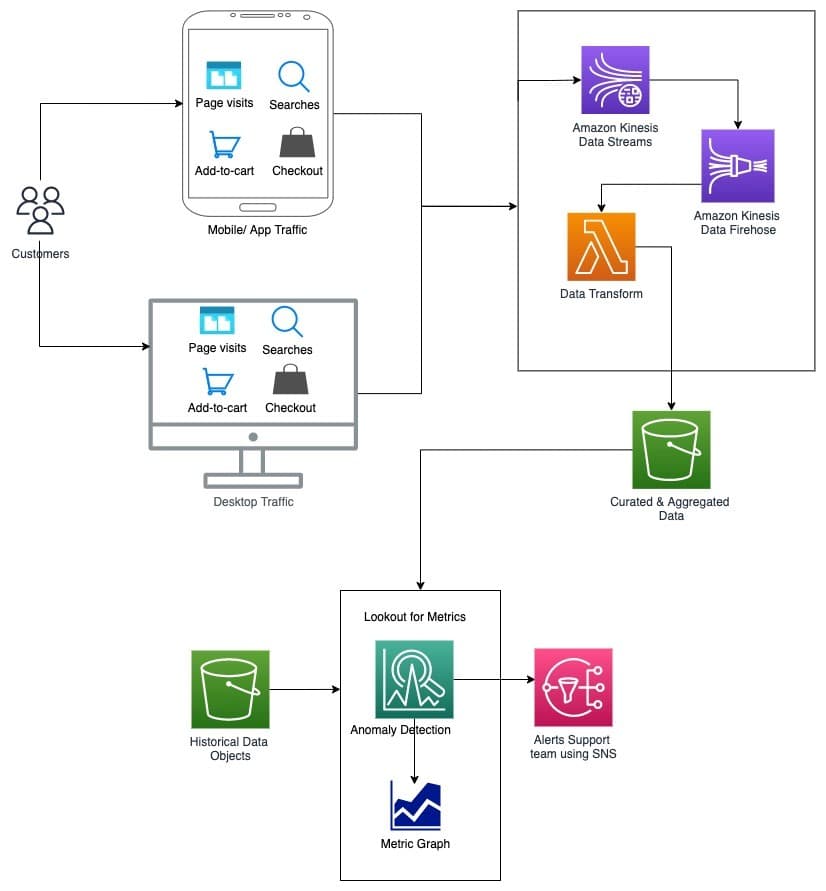
Design a Real-Time Anomaly Detection System for E-commerce Events
This tests your ability to design a real-time data pipeline and apply ML to a business problem. Outline a streaming architecture (e.g., Kinesis), processing, and storage.
How would you measure P95 latency by geographic region?
Tests your ability to translate a business need into a concrete observability implementation. A good answer involves instrumenting the API with a histogram metric, adding a region label via GeoIP, and querying with histogram_quantile.
How would you capture UTM parameters for attribution?
This tests your grasp of the data lifecycle from capture to persistence. A good answer covers client-side parsing, cookie storage, and linking anonymous data to a user record upon sign-up. A red flag is forgetting to persist the data server-side.
Describe the client-side event for an 'Add to Cart' button
Tests your knowledge of standard analytics schemas (like GA4) and designing payloads for business analysis. A great answer names the 'add_to_cart' event, details the 'items' array with product data, and mentions user/session context.
Describe two methods for generating prediction intervals
This tests your grasp of uncertainty quantification. A great answer contrasts an analytical method (assuming normal errors, using multipliers like 1.96 for 95%) with a simulation method (bootstrapping residuals).
How do you diagnose and fix a model's degrading performance?
Tests your MLOps process for handling model decay. Name it "concept drift," then outline a plan: diagnose by comparing data distributions, solve with a targeted retraining strategy, and implement proactive monitoring. A red flag is just saying "retrain it."

Which model for forecasting with seasonality and trend?
This tests your knowledge of classical time series models. A good answer names Holt-Winters, explaining its level, trend, and seasonal components. It also discusses choosing between additive and multiplicative methods. A red flag is jumping to complex models.
Train-Test Split vs. Time-Series Cross-Validation
This tests your grasp of data leakage in temporal data. A good answer explains why random splits create lookahead bias, then details how rolling-origin validation respects time. A red flag is just describing methods without explaining *why* one is necessary.
Explain time series stationarity and how to achieve it
Tests your grasp of core time series assumptions. Define stationarity (constant mean/variance over time), explain why models need it for stable predictions, and name methods to test and achieve it. A red flag is just saying the data looks 'flat'.
How would you measure a sales forecast model's accuracy?
Tests if you can link statistical metrics to business outcomes. Define MAE (average error) and RMSE (penalizes large errors). Choose RMSE when large misses are costly (e.g., stock-outs), MAE otherwise. A red flag is reciting formulas without business context.
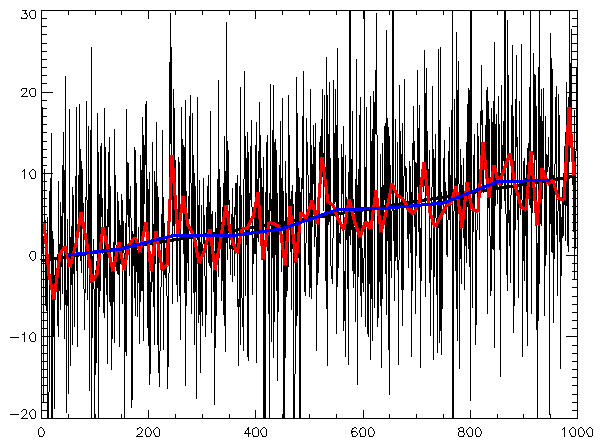
How would you analyze a time series of user sign-ups?
This tests your structured approach to decomposing time series data. A strong answer identifies trend (long-term growth), seasonality (weekly/yearly patterns), and irregular components like spikes or dips.

How CUPED increases statistical power in experiments
Tests your grasp of variance reduction in A/B testing. Explain how CUPED uses correlated pre-experiment data to reduce outcome variance, increasing statistical power. A red flag is confusing it with simpler difference scores, which can actually increase noise.
Why is user-level randomization flawed by spillover effects?
Tests your grasp of SUTVA violations in network experiments. Explain how spillover contaminates the control group, then propose graph cluster randomization—grouping users and assigning entire clusters to A/B variants—to minimize interference.

Primary vs. Guardrail Metrics in Experiments
Tests your grasp of risk management in A/B testing. A great answer defines a primary metric as the goal and a guardrail as a 'do no harm' check. A feature ships only if the primary improves without hurting guardrails.
What is the novelty effect in experimentation?
This tests your grasp of temporary user behavior changes that can invalidate A/B tests. A strong answer defines the effect, explains how it inflates metrics, and suggests running tests longer or segmenting by user tenure. A red flag is ignoring mitigation.
Why is stopping an A/B test early problematic?
Tests understanding of the 'peeking problem' in A/B testing. A good answer defines peeking, explains how it inflates false positive rates, and contrasts it with waiting for a pre-determined sample size. A red flag is not explaining the statistical mechanism.